IH Metrics
5 likes1,893 views

The document discusses using key metrics to support industrial hygiene programs. It notes that metrics can increase visibility, value, and consideration for resource allocation. Typical health and safety metrics are outlined, but they are described as lagging indicators that lack an IH element. The document advocates for leading indicators that measure goals and drivers of future performance. It provides examples of smart and poor metrics, and suggests metrics addressing IH issues like exposure anticipation, recognition, evaluation and control. Both lagging and leading metrics are illustrated for exposure incidents and strategic sampling goals.
IH Metrics
- 1. Using Key Metrics to Support Industrial Hygiene Dale Rhodes MSPH, CIH NOHCE 2009 1
- 2. IH Metrics, WhatŌĆÖs the Point? Visibility of IH program and accomplishments Value advertising Consideration in resource allocation 2
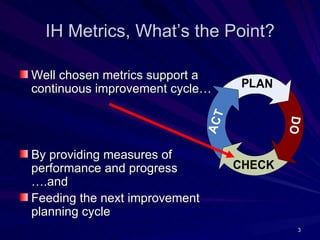
- 3. IH Metrics, WhatŌĆÖs the Point? Well chosen metrics support a continuous improvement cycleŌĆ” PLAN ACT DO By providing measures of performance and progress CHECK ŌĆ”.and Feeding the next improvement planning cycle 3
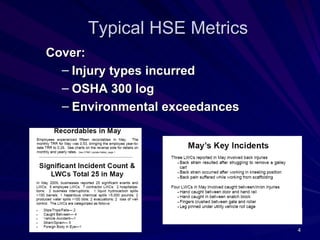
- 4. Typical HSE Metrics Cover: ŌĆō Injury types incurred ŌĆō OSHA 300 log ŌĆō Environmental exceedances 4
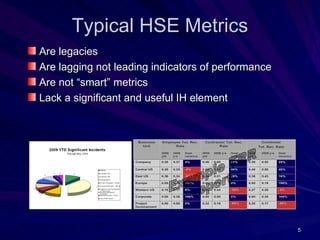
- 5. Typical HSE Metrics Are legacies Are lagging not leading indicators of performance Are not ŌĆ£smartŌĆØ metrics Lack a significant and useful IH element Business Employee Tot. Rec. Contractor Tot. Rec. Combined Unit Rate Rate Tot. Rec. Rate 2009 2008 Goal 2009 2008 y-e Goal 2009 2008 y-e Goal ytd y-e variance ytd variance ytd variance Company 0.26 0.27 4% 0.46 0.65 29% 0.39 0.52 25% Central US 0.26 0.25 -4% 0.57 1.02 44% 0.48 0.80 40% East US 0.36 0.34 -6% 0.36 0.51 29% 0.36 0.43 16% Europe 0.00 0.20 100% 0.00 0.00 0% 0.00 0.19 100% Western US 0.16 0.17 6% 0.55 0.44 -25% 0.27 0.26 -4% Corporate 0.00 0.36 100% 0.00 0.00 0% 0.00 0.35 100% Project 0.00 0.00 0% 0.32 0.19 -68% 0.28 0.17 -65% Development 5
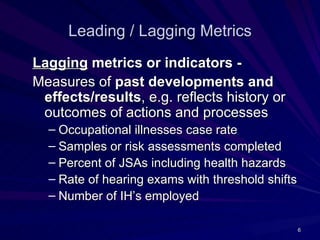
- 6. Leading / Lagging Metrics Lagging metrics or indicators - Measures of past developments and effects/results, e.g. reflects history or outcomes of actions and processes ŌĆō Occupational illnesses case rate ŌĆō Samples or risk assessments completed ŌĆō Percent of JSAs including health hazards ŌĆō Rate of hearing exams with threshold shifts ŌĆō Number of IHŌĆÖs employed 6
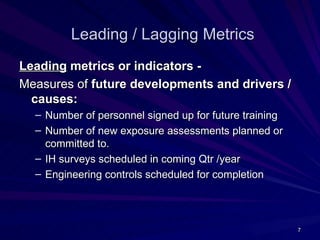
- 7. Leading / Lagging Metrics Leading metrics or indicators - Measures of future developments and drivers / causes: ŌĆō Number of personnel signed up for future training ŌĆō Number of new exposure assessments planned or committed to. ŌĆō IH surveys scheduled in coming Qtr /year ŌĆō Engineering controls scheduled for completion 7
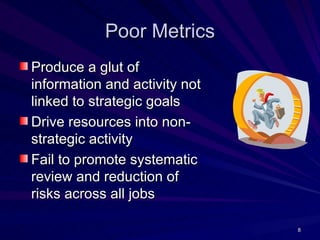
- 8. Poor Metrics Produce a glut of information and activity not linked to strategic goals Drive resources into non- strategic activity Fail to promote systematic review and reduction of risks across all jobs 8
- 9. ŌĆ£SmartŌĆØ Metrics Smart metrics are simply measures of SMART goals. These Goals are: ŌĆō Strategic, ŌĆō Measureable, ŌĆō Actionable, ŌĆō Relevant, and ŌĆō Time based: 9
- 10. ŌĆ£SMARTŌĆØ Metrics Smart IH objectives and goals align with: ŌĆó Company IH & Occ. Health high level standards ŌĆó Company IH & Occ. Health strategic initiatives. ŌĆó Business strategic objectives Smart metrics measure & drive progress towards core IH objectives and goals over set time periods 10
- 11. Key Metrics ŌĆō Other Desireable Attributes Universal Defined ownership Analyzable Optimal in number Simplicity aligned to level of use 11
- 13. Caveats ..Make sure the whole message your metrics send is consistent with your core reason for metrics. POOR: - YTD performed 1,000 repeat hexane tests of which 99.5% were < 10% of OEL BETTER: - YTD, Completed 112 new/updated exposure assessments, corrected 4 uncontrolled exposures 13
- 14. Core IH Issues to Address Anticipation: ŌĆō MOCs and project planning include IH reviews Recognition ŌĆō % of job tasks with current QEAs Evaluation ŌĆō Risk based priority sampling completion 14
- 15. Core IH Issues to Address Control ŌĆō Unprotected Overexposure Incidents ŌĆō Driving Down Risks Across All Job tasks ŌĆō Exposure Controls Implementation 15
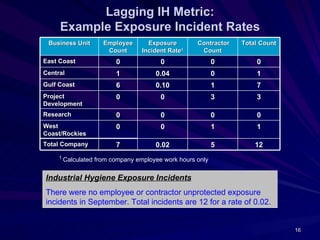
- 16. Lagging IH Metric: Example Exposure Incident Rates Business Unit Employee Exposure Contractor Total Count Count Incident Rate1 Count East Coast 0 0 0 0 Central 1 0.04 0 1 Gulf Coast 6 0.10 1 7 Project 0 0 3 3 Development Research 0 0 0 0 West 0 0 1 1 Coast/Rockies Total Company 7 0.02 5 12 1 Calculated from company employee work hours only Industrial Hygiene Exposure Incidents There were no employee or contractor unprotected exposure incidents in September. Total incidents are 12 for a rate of 0.02. 16
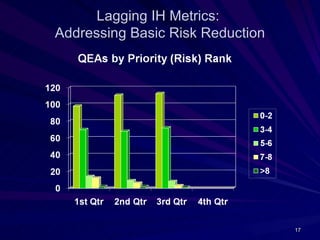
- 17. Lagging IH Metrics: Addressing Basic Risk Reduction 17
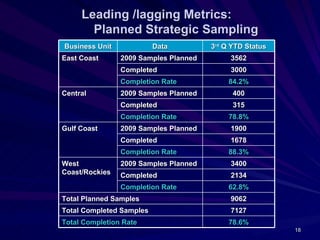
- 18. Leading /lagging Metrics: Planned Strategic Sampling Business Unit Data 3rd Q YTD Status East Coast 2009 Samples Planned 3562 Completed 3000 Completion Rate 84.2% Central 2009 Samples Planned 400 Completed 315 Completion Rate 78.8% Gulf Coast 2009 Samples Planned 1900 Completed 1678 Completion Rate 88.3% West 2009 Samples Planned 3400 Coast/Rockies Completed 2134 Completion Rate 62.8% Total Planned Samples 9062 Total Completed Samples 7127 Total Completion Rate 78.6% 18
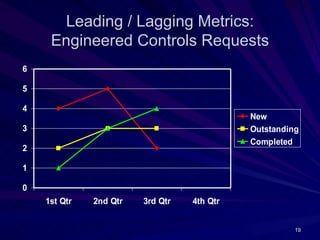
- 19. Leading / Lagging Metrics: Engineered Controls Requests 6 5 4 New 3 Outstanding Completed 2 1 0 1st Qtr 2nd Qtr 3rd Qtr 4th Qtr 19
- 20. Suggested Resources 1. 2. ŌĆó Donald Kennedy et al, NDIA Environmental Meeting April 2004 ŌĆó Paul Esposito Industrial Hygiene Performance Metrics Manual, AIHCE 2002 20
Editor's Notes
- #2: Good morning. Due to the key NOHC metric requiring completion within 20 minutes my presentation today is only an overview of the topic of metrics design and their use in supporting industrial hygiene programs within a larger business organization. There has been a good deal of activity in recent years related to the topic of IH metrics in the form of conference courses, PDCŌĆÖs and AIHA work and publications. This short survey of the topic is a more experience based rather than rigorous academic approach.
- #3: So, if you have been a free range IH for years, doing whatever you think is important, what is the point of adopting IH metrics? Point 1 --- With no key IH/OH metrics, program value and accomplishments are invisible outside your functional group. Point 2 - Well designed key metrics continuously advertise IH as key to achieving outcomes or goals of value to the larger organization. Point 3 - When corporate leaders review sites based on a basket of performance measures, those things in the basket have a better chance for local resource allocation than those issues not included. ŌĆ” IH needs to get in the basket!
- #4: 1) Well chosen metrics support a continuous improvement cycle, helping sustain improvement year over year ŌĆ” By providing measures of performance and progress ŌĆ”.an d 3) Feeding the next improvement planning cycle
- #5: Typical HSE Metrics cover: Injury types incurred OSHA 300 log Environmental exceedances
- #6: Typical HSE MetricsŌĆ” Are legaciesŌĆ”whoŌĆÖs use may have become more ritual than value adding Lack a significant and useful IH element Are lagging not leading indicators of performance Are not ŌĆ£smartŌĆØ metrics..... These last two assertions will be made clearer to those not familiar with the terms.
- #7: Lagging metrics or indicators - Are Measures of past developments and effects/results , e.g. reflects history or outcomes of actions and processes ŌĆ”. Examples include: Occupational illnesses case rate Samples or risk assessments completed Percent of JSAs including health hazards Rate of hearing exams with threshold shifts Number of IHŌĆÖs employed
- #8: Leading metrics or indicators - Are measures of future developments and drivers / causes: Number of personnel signed up for future training Number of new exposure assessments planned or committed to. IH surveys scheduled in coming Qtr /year Engineering controls scheduled for completion
- #9: What are some marks of a poor metric? Metrics that: Produce a glut of information and activity not linked to strategic goals Drive resources into non-strategic activity Fail to promote systematic review and reduction of risks across all jobs
- #10: Now, just what are ŌĆ£smartŌĆØ metrics? Smart metrics are simply proof measures of SMART goals. These are goals that are: Strategic, Measureable, Actionable, Relevant, and Time based: Smart metrics will measure & drive progress towards core IH objectives and goals over set time periods
- #11: Smart IH objectives and goals align with: Company IH & Occ. Health high level standards Company IH & Occ. Health strategic initiatives. Business strategic objectives SoŌĆ”we can say smart metrics measure & drive progress towards core IH objectives and goals over set time periods
- #12: Some basic considerations in design of Key metrics or performance indicators are: Universality across all business units. DonŌĆÖt set up an ŌĆ£apples and oranges comparisonŌĆØ situation Defined ownership ŌĆō Who is responsible and for what. KPIs need instructions or policies for implementation. Analyzable ŌĆō A typical metric tells you what is happening.. can analysis tell you why? Or yield any other useful insights? Actionable - After being analyzed a KPI should be able to lead to the decisions and actions to improve or sustain the performance on the given KPI Optimal in number ŌĆō High level KPIs should be linked to your top few root objectives. They should have little or no overlap. Collecting and analyzing data for KPI reporting generates additional work so that performance benefits diminish rapidly as you increase the number of KPI reported. Simplicity aligned to level of use - Design KPI complexity for your audience. The higher up the managerial structure it is targeted the more elegantly simple, and familiar in design I would recommend you make it.
- #13: For good or bad, metrics are apt to be permanent or at least difficult to change once established as part of an organizationsŌĆÖ culture; for example LWCIR or TRR Make sure your metrics are structured to address fundamental factors immune to time. And, if you want metrics to support resource allocationsŌĆ”ŌĆ”.
- #14: ..Make sure the whole picture the metrics send is internally consistent with your intent. poor example: - performed 1,000 repeat hexane tests YTD of which 99.5% were < detect level, versus; YTD, Completed 112 new/updated job/task risk assessments, corrected 4 uncontrolled exposures
- #15: I have a few specific examples addressing core IH concernsŌĆ” Anticipation: MOCs and project planning include IH reviews Recognition % of job tasks with current QEAs Evaluation Risk based priority sampling completionŌĆ”.AND:
- #16: ControlŌĆ”examples include: Unprotected Overexposure Incidents Driving Down Risks Across All Job tasks Driving Exposure Controls Implementation
- #17: IH metrics can drive improvement in respirator use during all potential exposures including release response.
- #18: IH metrics can integrate with exposure assessment and control programs, to encourage risk reduction measure implementation. This performance indicator encourages business units to drive risk rankings down to avoid reporting poorly controlled high priority risks.
- #19: Leading / Lagging metrics combinations can be used to drive and track qualitative assessment driven sampling for quantitative assessments.
- #20: A combination Leading / lagging metric can be designed to encourage and track risk reduction controls efforts.
- #21: For a deeper understanding and other viewpoints I suggest the following resources, and would be happy to send requestors a copy of the poster that was presented at AIHCE 2009, presenting ConocoPhillips CoŌĆÖs journey to IH metrics design and adoption.