Image processing - Histogram Equalization
- 1. Image Processing Report Histogram Equalization
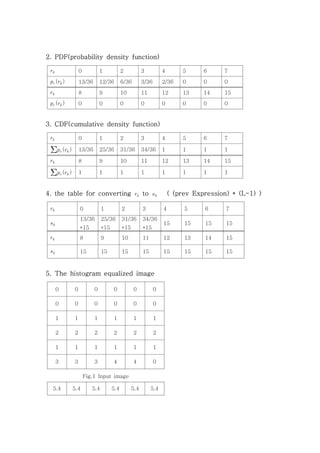
- 2. Image Processing - Report #1 Due date: April. 2, 2018 In our class, we have learned about a histogram equalization technique to enhance the images's quality. Histograms are the basics for numerous spatial domain techniques. Simple examples can help you to understand how to equalize the histogram in an image. Suppose that Fig. 1 is a 4-bit input image(L=16) of size 6├Ś6 pixels. And also we assume that 0 is black and 15 is white. Now calculate the histogram equalized image. You need to calculate histogram, PDF(probability density function), CDF(cumulative density function), and the table for converting ŅāČŅā» to ŅāĘŅā». When you calculate s values, ŅāĘŅā», you round them to the nearest integer. Finally, explain the result comparing to the input image in point of their contrasts. You have to submit the report in class. 1. The Histogram of the input image. ŅāČŅā» 0 1 2 3 4 5 6 7 frequency 13 12 6 3 2 0 0 0 ŅāČŅā» 8 9 10 11 12 13 14 15 frequency 0 0 0 0 0 0 0 0 0 0 0 0 0 0 0 0 0 0 0 0 1 1 1 1 1 1 2 2 2 2 2 2 1 1 1 1 1 1 3 3 3 4 4 0 Fig.1 Input image
- 3. 2. PDF(probability density function) 3. CDF(cumulative density function) 4. the table for converting ŅāČŅā» to ŅāĘŅā» ( (prev Expression) * (L-1) ) 5. The histogram equalized image ŅāČŅā» 0 1 2 3 4 5 6 7 Ņā┤ŅāČ ŅüäŅāČŅā» Ņüģ 13/36 12/36 6/36 3/36 2/36 0 0 0 ŅāČŅā» 8 9 10 11 12 13 14 15 Ņā┤ŅāČ ŅüäŅāČŅā» Ņüģ 0 0 0 0 0 0 0 0 ŅāČŅā» 0 1 2 3 4 5 6 7 Ņü¦Ņā┤ŅāČ ŅüäŅāČŅā» Ņüģ 13/36 25/36 31/36 34/36 1 1 1 1 ŅāČŅā» 8 9 10 11 12 13 14 15 Ņü¦Ņā┤ŅāČ ŅüäŅāČŅā» Ņüģ 1 1 1 1 1 1 1 1 ŅāČŅā» 0 1 2 3 4 5 6 7 ŅāĘŅā» 13/36 *15 25/36 *15 31/36 *15 34/36 *15 15 15 15 15 ŅāČŅā» 8 9 10 11 12 13 14 15 ŅāĘŅā» 15 15 15 15 15 15 15 15 5.4 5.4 5.4 5.4 5.4 5.4 0 0 0 0 0 0 0 0 0 0 0 0 1 1 1 1 1 1 2 2 2 2 2 2 1 1 1 1 1 1 3 3 3 4 4 0 Fig.1 Input image
- 4. Ļ░Ćņן ĻĘ╝ņĀæĒĢ£ ņĀĢņłśļĪ£ ļ░śņś¼ļ”╝ 6. Explain the result comparing to the input image in point of their contrasts. ņØä ĒåĄĒĢ┤ ņ×ģļĀź ņØś ņĀĆļīĆļ╣ä ļ░Å ļé«ņØĆ ĒÅēĻĘĀHistogram Equalization Matrix Gray ņØś Ļ░ÆņØś ņśüņāüņØä ļ╣äĻĄÉņĀü Ļ│ĀļźĖ ļČäĒżņØś ņØä Ļ░Ćņ¦ä ļĪ£ ļ░öĻ┐ĆLevel Histogram Matrix ņłś ņ׳ņŚłļŗż. ĒĢśņ¦Ćļ¦ī ļ│ĆĒÖśņØä ņłśĒ¢ēĒĢ£ Ēæ£ļ¦ī Ļ░Ćņ¦ĆĻ│Ā ļ╣äĻĄÉĒĢ©ņØĆ Ļ░ĆņŗØņä▒ņØ┤ ļ¢©ņ¢┤ņ¦ĆĻĖ░ ļĢīļ¼ĖņŚÉ ņ£ä, ņØś ĒÆĆņØ┤Ļ│╝ņĀĢņØä ņĢīĻ│Āļ”¼ņ”śĒÖö ĒĢśņŚ¼ ņĮöļō£ļĪ£ ļ│ĆĒÖśĒĢ£ Ēøä ņŻ╝ņ¢┤ņ¦ä ļź╝ Ļ░Ćņ¦ĆĻ│Ā, Matrix 5.4 5.4 5.4 5.4 5.4 5.4 10.4 10.4 10.4 10.4 10.4 10.4 12.9 12.9 12.9 12.9 12.9 12.9 10.4 10.4 10.4 10.4 10.4 10.4 14.1 14.1 14.1 15 15 5.4 Fig.2 Output image 5 5 5 5 5 5 5 5 5 5 5 5 10 10 10 10 10 10 13 13 13 13 13 13 10 10 10 10 10 10 14 14 14 15 15 5 Fig.3 Output image with rounded ŅĆīŅāźŅāĖŅā©Ņā®ŅāĘŅāĖ 0 1 2 3 4 5 6 7 frequency 0 0 0 0 0 13 0 0 ŅĆīŅāźŅāĖŅā©Ņā®ŅāĘŅāĖ 8 9 10 11 12 13 14 15 frequency 0 0 12 0 0 6 3 2 Fig.4 Histogram of the Output image
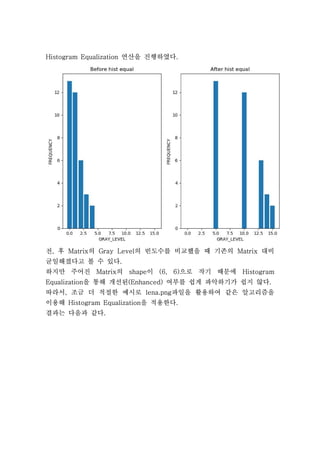
- 5. ņŚ░ņé░ņØä ņ¦äĒ¢ēĒĢśņśĆļŗżHistogram Equalization . ņĀä Ēøä ņØś ņØś ļ╣łļÅäņłśļź╝ ļ╣äĻĄÉĒ¢łņØä ļĢī ĻĖ░ņĪ┤ņØś ļīĆļ╣ä, Matrix Gray Level Matrix ĻĘĀņØ╝ĒĢ┤ņĪīļŗżĻ│Ā ļ│╝ ņłś ņ׳ļŗż. ĒĢśņ¦Ćļ¦ī ņŻ╝ņ¢┤ņ¦ä ņØś ņØ┤ ņ£╝ļĪ£ ņ×æĻĖ░ ļĢīļ¼ĖņŚÉMatrix shape (6, 6) Histogram ņØä ĒåĄĒĢ┤ Ļ░£ņäĀļÉ£ ņŚ¼ļČĆļź╝ ņēĮĻ▓ī ĒīīņĢģĒĢśĻĖ░Ļ░Ć ņēĮņ¦Ć ņĢŖļŗżEqualization (Enhanced) . ļö░ļØ╝ņä£ ņĪ░ĻĖł ļŹö ņĀüņĀłĒĢ£ ņśłņŗ£ļĪ£ ĒīīņØ╝ņØä ĒÖ£ņÜ®ĒĢśņŚ¼ Ļ░ÖņØĆ ņĢīĻ│Āļ”¼ņ”śņØä, lena.png ņØ┤ņÜ®ĒĢ┤ ņØä ņĀüņÜ®ĒĢ£ļŗżHistogram Equalization . Ļ▓░Ļ│╝ļŖö ļŗżņØīĻ│╝ Ļ░Öļŗż.
- 6. ĻĖ░ņĪ┤ ĻĘĖļ”¼Ļ│Ā ņśüņŚŁņŚÉ ļ╣äņ¢┤ņ׳ļŖö ņØś ļ╣łļÅäņłśļź╝0~50, 225~250 Gray Level ņØä ĒåĄĒĢ┤ ņĀäņ▓┤ ņśüņŚŁņŚÉ ļ╣łļÅäņłśĻ░Ć Ļ│Āļź┤Ļ▓ī ļČäĒżEqualization 0~255 Gray Level ļÉ£ Ļ▓ā Ļ│ĀļīĆļ╣ä ņśüņāüņ£╝ļĪ£ ļ│ĆĒĢ£ Ļ▓ā ņØä ĒÖĢņØĖĒĢĀ ņłś ņ׳ņŚłļŗż( ) . ļśÉĒĢ£ ņØä ĒåĄĒĢ┤ ļÅäņČ£ļÉ£ Ļ░ÆļōżņØä ĒĢ®ĒĢśņŚ¼ ņØś, Histogram Equalization Matrix Size ļĪ£ ļéśļłłĻ░ÆņØ┤ ņØś ņĀłļ░śĻ░ÆĻ│╝ ļ╣äņŖĘĒĢ┤ ņ¦äļŗżļŖö Ļ▓āņØä ņĢī ņłś ņ׳ņŚłļŗżMax Gray Level(2^Bit 1) .ŌĆō ņ×ģļĀź Ē¢ēļĀ¼ņŚÉņä£1) 6*6 , (5*13 + 10*12 + 13*6 + 14*3 +15*2) / (6*6) = 9.3 16/2 = 8 ņŚÉņä£2) lena.png , 33743418/ (512*512) = 128.7209 256 / 2 = 128 ņóĆ ļŹö Ēü░ ļ░░ņŚ┤ņØä ņ×ģļĀźņ£╝ļĪ£ ņŻ╝ņŚłņØä ļĢī ĻĘĖ ĻĘ╝ņé¼ņĀĢļÅäĻ░Ć ņ╗żņĪīļŗżĻ│Ā ļ│╝ ņłś ņ׳ļŗż.
- 7. ļö░ļØ╝ņä£ ļŗżņØīĻ│╝ Ļ░ÖņØĆ ņŗØņØä ļÅäņČ£ĒĢĀ ņłś ņ׳ņŚłņ£╝ļ®░ ņŚÉ ļīĆĒĢ£ ĻĘ╝ņé¼ņĀĢļÅäĻ░Ć ņ╗żņ¦ł, , L/2 ņłśļĪØ ņØś ļ╣łļÅäņłśĻ░Ć Ļ│Āļź┤Ļ▓ī ļČäļ░░ļÉśņŚł ļŗżļŖö Ļ▓āņØä ņĢī ņłś ņ׳ņŚłļŗżGray Level . Ņü¦Ņā▓ Ņüć ŅĆĮ ŅĆŗŅüå ŅĆ┤ ŅüäŅĆäŅāźŅā¦Ņā¼ ŅĆåŅāČŅāźŅāĮ ŅĆŗŅā®Ņā║Ņā®Ņā░ŅāĘŅüēŅā▓ŅüŖŅüāŅĆģŅāČŅā®ŅāĄŅā╣Ņā®Ņā▓Ņā¦ŅāŁŅā®ŅāĘŅüēŅā▓ŅüŖŅüģŅüöŅüäŅĆīŅĆĆŅĆō_ŅĆ¢ŅĆłŅĆāŅĆōŅĆćŅüāŅĆīŅĆĆŅĆō_ŅĆćŅĆäŅĆłŅĆåŅĆćŅĆōŅüģŌēłŅĆŗŅüöŅĆĄ


