


Improving Object Detection on Low Quality Images
- 1. S+SSPR Workshop 2024 Improving object detection on low-quality images yohanes.nuwara@gsom.polimi.it https://www.linkedin.com/in/ yohanesnuwara/ YOHANES NUWARA (Politecnico di Milano, GSOM) HUY-QUOC TRINH (Spex GmbH)
- 2. WHO AM I 07.2024 ŌĆō Present Prores AS (Norway) 10.2023 ŌĆō 06.2024 Politecnico di Milano (Italy) 06.2024 ŌĆō Present Chief AI @ Agrari (Indonesia) 02.2022 ŌĆō 10.2023 Asia Pulp and Paper (Indonesia) Computer vision researches and projects 2024: Automated rock property prediction from drilling core photos (Prores) 2024: Improving object detection in agriculture (S+SSPR, Venice) 2023: CitricNet, object detection for oranges 2022: DDP and AMP for improving satellite image classification (ICMV, Rome)
- 3. LECTURE OUTLINES S+SSPR 2024 Impact on object detection Image quality issue Does augmentation help? Proposed method Conclusion
- 4. IMAGE IN THE AGRICULTURE INDUSTRY Traditional quality grading Traditional process in oil palm industry includes oil palm fruit quality grading that happens after the fruits are collected on the ground The need for imaging becomes inevitable because faster quality grading is required for automation Modern industry can rely on drones to take the photos and computer vision to run the quality grading
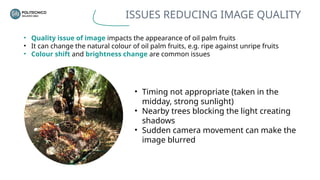
- 5. ISSUES REDUCING IMAGE QUALITY ŌĆó Timing not appropriate (taken in the midday, strong sunlight) ŌĆó Nearby trees blocking the light creating shadows ŌĆó Sudden camera movement can make the image blurred ŌĆó Quality issue of image impacts the appearance of oil palm fruits ŌĆó It can change the natural colour of oil palm fruits, e.g. ripe against unripe fruits ŌĆó Colour shift and brightness change are common issues
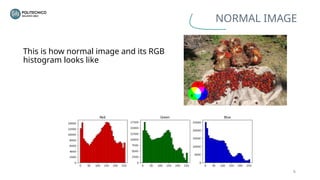
- 6. This is how normal image and its RGB histogram looks like 6 NORMAL IMAGE
- 7. Yellow cast is a condition where image look dominant yellowish 7 Red and Green channel have the same ŌĆśCamel HumpbackŌĆÖ shape distribution * YELLOW CASTED IMAGE
- 8. Overexposure is a condition where image looks very bright because of excessive lighting e.g. from the sun 8 All RGB channels have peak in the high pixel intensity (200-256) * OVEREXPOSED IMAGE
- 9. Shadowed is a condition where image looks shadowed because of object nearby blocking the light 9 All RGB channels have peak in the low pixel intensity (10-50) SHADOWED IMAGE
- 10. Object Detection
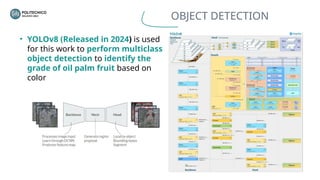
- 11. OBJECT DETECTION ŌĆó YOLOv8 (Released in 2024) is used for this work to perform multiclass object detection to identify the grade of oil palm fruit based on color
- 12. Bounding box are decoded as Mx6 matrix M is the number of detected fruits 1 2 3 4 class, x, y, w, h, confidence 0 0.32 0.44 0.46 0.57 0.5 0 0.54 0.67 0.44 0.32 0.75 1 0.45 0.87 0.74 0.11 0.6 1 0.22 0.11 0.45 0.67 0.6 1 2 3 4 OBJECT DETECTION RESULT
- 14. Exposure and brightness augmentation (happen in RGB color space) Ø£Č=ؤÅ,ØÆā=ؤŠأČ=ؤÉ,ØÆā=ؤŠأČ=ؤæ,ØÆā=ؤŠأČ=ؤÅ,ØÆā=ؤÉؤō Ø£Č=ؤÅ,ØÆā=ؤōØ¤Ä Ø£Č=ؤÅ,ØÆā=ؤÅؤÄØ¤Ä BRIGHTNESS AUGMENTATION Brightness constant Exposure coefficient
- 15. HSV RGB Ø£Ė=ؤÄ.ؤō Ø£Ė=Ø¤É Ø£Ė=ؤō Saturation augmentation (happen in HSV color space ŌĆō S channel) ØæåŌĆ▓ =ØøŠ Øæå SATURATION AUGMENTATION Saturation coefficient
- 16. Hue augmentation Saturation augmentation Augmentation in commercial softwares e.g. Roboflow AUGMENTATION
- 17. DETECTION RESULT ON AUGMENTED SETS Miss detect : 2 Miss detect : 5 Miss detect : 6 Miss detect : 3 Miss detect : 1 Miss detect : 2 ŌĆó Missed detections still can be found although augmentation has been applied
- 19. WORKFLOW HM : Histogram Matching M1 : Object detection on normal image M2 : Object detection on transformed image NMS : Model stacking with adaptive NMS
- 20. Source image with overexposure s Reference image d cdf(s)’āĀ cdf(d) CDF of source image cdf(s) CDF of reference image cdf(d) HISTOGRAM MATCHING
- 21. MODEL DEVELOPMENT Original images Transformed images Model M1 Model M2 Model strengths and limitations (+) Able to classify different classes (-) Missed detection due to abnormal image quality (+) Able to detect all independent fruits (-) Prefers one class with high confidence score Higher class accuracy Higher location accuracy
- 22. 0 0.32 0.44 0.46 0.57 0.5 0 0.54 0.67 0.44 0.32 0.4 1 0.45 0.87 0.74 0.11 0.5 1 0.22 0.11 0.45 0.67 0.6 0 0.32 0.44 0.46 0.87 0.9 0 0.54 0.67 0.44 0.92 0 0.32 0.44 0.46 0.57 0.9 0 0.54 0.67 0.44 0.32 0.8 0 0.56 0.11 0.34 0.11 0.8 0 0.12 0.45 0.38 0.60 0.9 0 0.66 0.77 0.32 0.55 0.7 0 0.58 0.19 0.38 0.32 0.8 0 0.32 0.44 0.46 0.57 0.5 0 0.54 0.67 0.44 0.32 0.4 1 0.45 0.87 0.74 0.11 0.5 1 0.22 0.11 0.45 0.67 0.6 MODEL STACKING Model M1 result on original image Model M2 result on transformed image Stacked model result A B Stack(A,B) C Overconfidence in M2
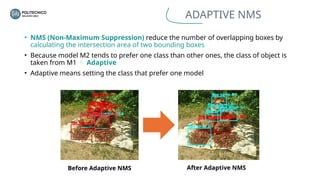
- 23. ADAPTIVE NMS ŌĆó NMS (Non-Maximum Suppression) reduce the number of overlapping boxes by calculating the intersection area of two bounding boxes ŌĆó Because model M2 tends to prefer one class than other ones, the class of object is taken from M1 ’āĀ Adaptive ŌĆó Adaptive means setting the class that prefer one model Before Adaptive NMS After Adaptive NMS
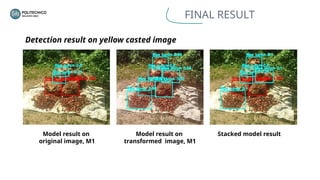
- 24. FINAL RESULT Detection result on yellow casted image Model result on original image, M1 Model result on transformed image, M1 Stacked model result
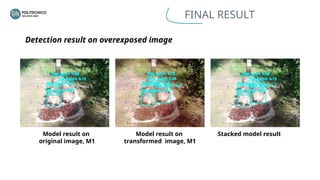
- 25. FINAL RESULT Detection result on overexposed image Model result on original image, M1 Model result on transformed image, M1 Stacked model result
- 26. FINAL RESULT Detection result on shadowed image Model result on original image, M1 Model result on transformed image, M1 Stacked model result
- 27. COMPARISON Strategy Location F1-score Class F1-score mAP@50-95 YOLOv8 without treatment (M1 model) 0.472 0.711 0.503 YOLOv8 + augmentation 0.459 0.702 0.521 YOLOv8 + HM (M2 model) 0.801 0.651 0.612 Stacked YOLOv8 (M1 + M2) 0.866 0.859 0.798 1) Location F1-score is calculated as the accuracy of fruit (regardless of its class) 2) Class F1-score is calculated as the accuracy of a class against other class 3) F1-score reported here is the average metric
- 28. CONCLUSION S+SSPR 2024 Applying augmentation on training sets does not help improving the performance of object detection model Image quality issue such as color shift and brightness change reduces object detection result Our proposed method using Histogram Matching and Model Stacking can drastically improve object detection model