Indonesian Coal Exports to the Philippines
- 1. Neil Little INTERNATIONAL MARKETING DIVISION HEAD PT ADARO INDONESIA 4th Coaltrans Emerging Asian Coal Markets
- 2. Disclaimer These materials have been prepared by PT Adaro Energy (the “Company”) and have not been independently verified. No representation or warranty, expressed or implied, is made and no reliance should be placed on the accuracy, fairness or completeness of the information presented or contained in these materials. The Company or any of its affiliates, advisers or representatives accepts no liability whatsoever for any loss howsoever arising from any information presented or contained in these materials. The information presented or contained in these materials is subject to change without notice and its accuracy is not guaranteed. These materials contain statements that constitute forward-looking statements. These statements include descriptions regarding the intent, belief or current expectations of the Company or its officers with respect to the consolidated results of operations and financial condition of the Company. These statements can be recognized by the use of words such as “expects,” “plan,” “will,” “estimates,” “projects,” “intends,” or words of similar meaning. Such forward-looking statements are not guarantees of future performance and involve risks and uncertainties, and actual results may differ from those in the forward-looking statements as a result of various factors and assumptions. The Company has no obligation and does not undertake to revise forward-looking statements to reflect future events or circumstances. These materials are for information purposes only and do not constitute or form part of an offer, solicitation or invitation of any offer to buy or subscribe for any securities of the Company, in any jurisdiction, nor should it or any part of it form the basis of, or be relied upon in any connection with, any contract, commitment or investment decision whatsoever. Any decision to purchase or subscribe for any securities of the Company should be made after seeking appropriate professional advice. 2
- 3. Outline SOUTHEAST ASIA ECONOMIC GROWTH • GDP Growth • Industrial Production • Power Capacity Growth PHILIPPINES DEMAND AND ITS NATURAL SUPPLIER • Philippines Demand • Competitiveness Analysis • Indonesia Coal Availability • A Natural Source of Supply and Long Term Challenges • Pricing Method OUR BUSINESS MODEL – INTRODUCTION TO ADARO • Pit-To-Port Integration • Pit-to-Port – The Supply Chain • Focus On Different Product Ranges 3
- 4. SOUTHEAST ASIAN ECONOMIC GROWTH GDP Growth Singapore Thailand Malaysia Philippines Indonesia Myanmar Laos Cambodia Source: WoodMackenzie Coal Market Service (2015), World Bank (2015) Vietnam GDP in real terms 4
- 5. SOUTHEAST ASIAN ECONOMIC GROWTH Industrial Production as % of GDP Malaysia Thailand Vietnam Philippines Indonesia Singapore CambodiaLaos Source: WoodMackenzie Coal Market Service (2015), World Bank (2015) 5
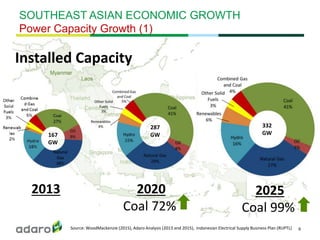
- 6. SOUTHEAST ASIAN ECONOMIC GROWTH Power Capacity Growth (1) Installed Capacity 2013 2020 Coal 72% 2025 Coal 99% Source: WoodMackenzie (2015), Adaro Analysis (2013 and 2015), Indonesian Electrical Supply Business Plan (RUPTL) 167 GW 287 GW 332 GW 6
- 7. SOUTHEAST ASIAN ECONOMIC GROWTH Power Capacity Growth (2) 2013 vs 2025 Installed Capacity (in GW) Combined Gas and Coal Other Solid Fuels Renewables Hydro Nuclear Natural Gas Oil Coal Total 2013 = 167 GW Total 2025 = 332 GW Source: WoodMackenzie (2015), Adaro Analysis (2013 and 2015), RUPTL 7
- 8. Outline SOUTHEAST ASIA ECONOMIC GROWTH • GDP Growth • Industrial Production • Power Capacity Growth PHILIPPINES DEMAND AND ITS NATURAL SUPPLIER • Philippines Demand • Competitiveness Analysis • Indonesia Coal Availability • A Natural Source of Supply and Long Term Challenges • Pricing Method OUR BUSINESS MODEL – INTRODUCTION TO ADARO • Pit-To-Port Integration • Pit-to-Port – The Supply Chain • Focus On Different Product Ranges 8
- 9. New Projects in the Pipeline PHILIPPINES DEMAND AND ITS NATURAL SUPPLIER Philippines Demand Source: Adaro Analysis (2015) COD CV Grand Total (MW) <4200 GAR 1,560 FDC Misamis 2016 - 2017 4,600 405 GNPower Lanao Kauswagan 2017 4,200 405 Limay Phase 1 & 2 2017 - 2018 4,200 300 GN Power Expansion 2019 4,221 1200 4200 - 5800 GAR 2,310 Calaca Phase 1 Expansion 2017 4,300 300 Subic Redondo 2018 4,600 600 Therma Visayas Energy Project 2017-2018 4,400 300 TSI Expansion 2017 4,400 150 Quezon Power Expansion 2018 4,500 500 SMC Davao 2 2018 4,500 150 SMC Davao 3 2020 4,500 300 5800 GAR 300 AES Expansion 2016 5,960 300 Other Power Plants 2016-2020 4,458 Grand Total by 2016 - 2020 8,628 9 4840 4860 4880 4900 4920 4940 4960 4980 0.00 10.00 20.00 30.00 40.00 50.00 60.00 2015 2016 2017 2018 2019 2020 2021 2022 2023 2024 2025 MillionTonnes Milliontonnes Forecast Import - Adaro vs WoodMac Coal Demand (100% of Plan Realized) (LHS) Coal Demand (50% of Plan Realized) (LHS) CV Average by Adaro (RHS)
- 10. 75.03 Source : Geological of Indonesia (2013), Minerba (2013), Badan Geologi (2014) 13.22 85.25 14.80 KalimantanSumatra 0.23 Sulawesi Maluku Papua Java Resources = 124.8 Reserves = 32.38 In Billion Tonnes PHILIPPINES DEMAND AND ITS NATURAL SUPPLIER Indonesian Coal Availability 10 By Coal Type Philippines Resource CV (GAD) Low Rank < 5,100 kcal/kg Medium Rank 5,100 - 6,100 kcal/kg High Rank > 6,100 - 7,100 kcal/kg Very High Rank > 7,100 kal/gr
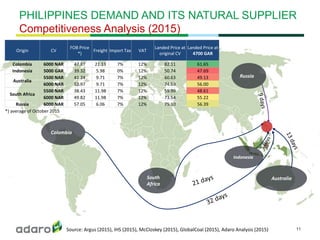
- 11. Colombia South Africa Indonesia Australia Russia Source: Argus (2015), IHS (2015), McCloskey (2015), GlobalCoal (2015), Adaro Analysis (2015) PHILIPPINES DEMAND AND ITS NATURAL SUPPLIER Competitiveness Analysis (2015) 11 Origin CV FOB Price *) Freight Import Tax VAT Landed Price at original CV Landed Price at 4700 GAR Colombia 6000 NAR 47.87 21.13 7% 12% 82.11 61.65 Indonesia 5000 GAR 39.32 5.98 0% 12% 50.74 47.69 Australia 5500 NAR 41.24 9.71 7% 12% 60.63 49.13 6000 NAR 52.97 9.71 7% 12% 74.59 56.00 South Africa 5500 NAR 38.43 11.98 7% 12% 59.99 48.61 6000 NAR 49.82 11.98 7% 12% 73.54 55.22 Russia 6000 NAR 57.05 6.06 7% 12% 75.10 56.39 *) average of October 2015
- 12. Price and freight based on annual average PHILIPPINES DEMAND AND ITS NATURAL SUPPLIER Competitiveness Analysis (2011 & 2013) Source: Argus (2015), IHS (2015), McCloskey (2015), GlobalCoal (2015), Adaro Analysis (2015) 12
- 13. PHILIPPINES DEMAND AND ITS NATURAL SUPPLIER A Natural Source of Supply and Long Term Challenges Indonesia has 1) Proximity / freight advantage 2) A large reserve and resource base 3) Reserve and resource in-line with project specification 4) Flexible shipping arrangements to meet a diverse range of discharge port requirements However 1) Based on an historical discount for Indonesian sub-bituminous material, current and future gCNEWC prices are now either close or below cost. This will inhibit ongoing investment into new capacity to meet growing export demand in South-east Asia 2) Indonesian supply requires increased price flexibility to meet regulatory requirements i.e. the HPB minimum selling price and DMO 3) As IPP’s typically rely on a gCNEWC linked index for project financing, it may be difficult for Indonesian suppliers to comply on a long term basis as gCNEWC may no longer accurately reflect Indonesian future coal price. 13
- 14. PHILIPPINES DEMAND AND ITS NATURAL SUPPLIER Pricing Method Source : Global Coal (2015), Argus/Coalindo (2015), Adaro Analysis (2015) 14 30.00 40.00 50.00 60.00 70.00 80.00 90.00 100.00 110.00 Jan-11 May-11 Sep-11 Jan-12 May-12 Sep-12 Jan-13 May-13 Sep-13 Jan-14 May-14 Sep-14 Jan-15 May-15 Sep-15 US$/tonne gCN-linked Price VS HPB Marker 5000 GAR gCN less 0% gCN less 5% gCN less 10% HPB Marker 0.00 0.05 0.10 0.15 0.20 0.25 0.30 0.35 0.00 20.00 40.00 60.00 80.00 100.00 120.00 140.00 Jan-09 Jun-09 Nov-09 Apr-10 Sep-10 Feb-11 Jul-11 Dec-11 May-12 Oct-12 Mar-13 Aug-13 Jan-14 Jun-14 Nov-14 Apr-15 Sep-15 %Discount US$/Tonne ICI3 vs gCN ICI 3 - 5000 GAR (LHS) gCN (LHS) Linear (Discounts to gCN)
- 15. Outline SOUTHEAST ASIA ECONOMIC GROWTH • GDP Growth • Industrial Production • Power Capacity Growth PHILIPPINES DEMAND AND ITS NATURAL SUPPLIER • Philippines Demand • Competitiveness Analysis • Indonesia Coal Availability • A Natural Source of Supply and Long Term Challenges • Pricing Method OUR BUSINESS MODEL – INTRODUCTION TO ADARO • Pit-To-Port Integration • Pit-to-Port – The Supply Chain • Focus On Different Product Ranges 15
- 16. OUR MODEL – INTRODUCTION TO ADARO Pit-to-Power Integration Adaro Indonesia (AI) Coal mining, S Kalimantan Balangan Coal mining, S Kalimantan Mustika Indah Permai (MIP) Coal mining, S Sumatra Bukit Enim Energi (BEE) Coal resource, S Sumatra IndoMet Coal Project (IMC), BHP JV Coal mining, C Kalimantan Bhakti Energi Persada (BEP) Coal resource, E Kalimantan 100% 75% 75% 61% 25% 10.2% Saptaindra Sejati (SIS) Coal mining and hauling contractor Jasapower Indonesia (JPI) Overburden crusher and conveyor operator 100% 100% 100% 100% 51.2% 100% Makmur Sejahtera Wisesa (MSW) 2 x 30MW mine- mouth power plant operation in S Kalimantan Bhimasena Power 2 x 1000MW power plant operator in Central Java South Kalimantan Power Project 2 x 100MW power plant operator in S Kalimantan 100% 34% 65% Maritim Barito Perkasa (MBP) Coal barging and shiploading operator Harapan Bahtera Internusa (HBI) Third-party barging and shiploading Sarana Daya Mandiri (SDM) Channel dredging contractor Indonesia Bulk Terminal (IBT) Coal and fuel terminal Adaro Mining Assets (ATA) Adaro Mining Services Adaro Logistics Adaro Power *Simplified Corporate Structure PT Adaro Energy 16
- 17. OUR MODEL – INTRODUCTION TO ADARO PIT-TO-PORT – THE SUPPLY CHAIN 80 Km haul road 230 Km barging Domestic supply 17 Taboneo Anchorage: International sales anchorage for the ship loading
- 18. OUR MODEL – INTRODUCTION TO ADARO Focus on Different Product Ranges COAL SPECIFICATIONS Basis Unit TUTUPAN E4100 Typical Typical Calorific Value GAR kcal/kg 4,700 - 5,000 4,000 - 4200 Total Moisture ARB % 26 - 28 38 - 40 Ash ARB % 2.5 - 3.0 3 - 4 Sulphur ARB % 0.1 - 0.15 0.2 - 0.3 Volatile Matter ADB % 42 - 43 41 - 42 HGI - - 46 - 47 55 - 61 Ash Fusion Temperature (reducing atmosphere) Initial deformation deg. C 0 C 1,140 - 1,150 1,150 – 1,160 18


