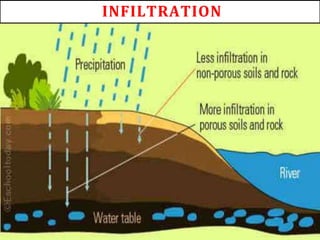


![b) Phillips equation :
Here a = Minimum infiltration capacity. s
= Initial infiltration capacity.
c) kostiakov equation:
c) holtans equation :
▣ Here in above methods a & n are constants
depends on soil moisture & vegetable cover
F=[ a+(s/2) x t-0.5 ]
F= (a x t n)
F = ( afn
p + fc )](https://image.slidesharecdn.com/infiltration-240126090121-838b78ef/85/Infiltration-ppt-31-320.jpg)


More Related Content
Similar to Infiltration.ppt (20)
Recently uploaded (20)


Infiltration.ppt
- 1. INFILTRATION
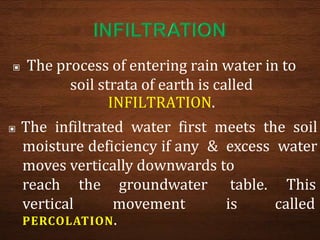
- 2. ▣ The process of entering rain water in to soil strata of earth is called INFILTRATION. ▣ The infiltrated water first meets the soil moisture deficiency if any & excess water moves vertically downwards to reach the vertical groundwater movement table. is This called PERCOLATION.
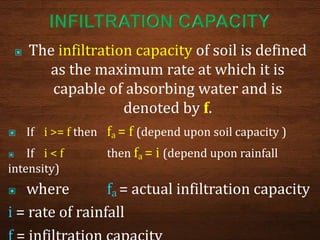
- 3. ▣ The infiltration capacity of soil is defined as the maximum rate at which it is capable of absorbing water and is denoted by f. ▣ If i >= f then fa = f (depend upon soil capacity ) ▣ If i < f then fa = i (depend upon rainfall intensity) ▣ where fa = actual infiltration capacity i = rate of rainfall
- 4. ▣ For Dry Soil – (infiltration rate) f is more Moist Soil – (infiltration rate) f is less ▣ Maximum rate of water absorption by soil –Infiltration Capacity ▣ Maximum capacity of water absorption by soil –Field Capacity
- 5. ▣ The rate at which soil is able to absorb rainfall or irrigation . ▣ It is measured in (mm/hr) or (inches/hr ) ▣ Infiltrometer is used for measurement of infiltration. ▣ If (i > f ) runoff occurs. ▣ Infiltration rate is connected to hydraulic conductivity.
- 6. ▣ Hydraulic conductivity is ability of a fluid to flow through a porous medium. It is determined by the size and shape of the pore spaces in the medium & viscosity of fluid. OR It is expressed as the volume of fluid that will move in unit time under a unit hydraulic gradient through a unit area measured perpendicular to the direction of flow.
- 7. ▣ SLOPE OF THE LAND:- The steeper the slope (gradient), the less the infiltration or seepage.
- 8. ▣ DEGREE OF SATURATION:- The more saturated the loose Earth materials are, the less the infiltration.
- 9. ▣ POROSITY:- Porosity is the percentage of open space (pores and cracks) in a earth surface.  The greater the porosity, the greater the amount of infiltration. SPONGE CLAY BRICK
- 11. ▣ COMPACTION:- The clay surfaced soils are compacted even by the impact of rain drops which reduce infiltration. This effect is negligible in sandy soils
- 12. ▣ SURFACE COVER CONDITION:- Vegetation:- Grasses, trees and other plant types capture falling precipitation on leaves and branches, keeping that water from being absorbed into the Earth & take more time to reach in to the ground.   MORE the vegetation Slower the Infiltration.
- 13. ÔÇß Land Use:- Roads, parking lots, and buildings create surfaces that are not longer permeable. Thus infiltration is less.
- 14. ▣ TEMPERATURE – At high temperature viscosity decreases and infiltration increases ▣ Summer – Infiltration ▣ Winter – Infiltration increases decreases FURROW IRRIGATION
- 15. ▣ OTHER FACTORS – a)Entrapped air in pores- Entrapped air can greatly affect the hydraulic conductivity at or near saturation b)Quality of water-Turbidity by colloidal water c)Freezing- Freezing in winter may lock pores. d)Annual & seasonal changes –According to change in land use pattern. Except for Massive deforestation & agriculture.
- 16. ▣ Infiltrometer is a device used to measure the rate of water infiltration into soil.
- 17. ▣ This consist of metal cylinder of diameter 25 cm to 30 cm and length of 50 cm to 60 cm, with both ends open. length of cylinder= ( 2 x diameter ) ▣ It is driven into a level ground such that about 10 cm of cylinder is above the ground. ▣ Water is poured into the top part to a depth of 5 cm & pointer is set inside the ring to indicate the water level to be maintained.
- 18. ▣ The single ring involves driving a ring into the soil and supplying water in the ring either at constant head or falling head condition. Constant head refers to condition where the amount of water in the ring is always held constant means the rate of water supplied corresponds to the infiltration capacity. Falling head refers to condition where water is supplied in the ring, and the water is allowed to drop with time. The operator records how much water goes into the soil for a given time period.
- 20. ▣ The major drawback of the single ring infiltrometer or tube infiltrometer is that the infiltrated water percolates laterally at the bottom of the ring. ▣ Thus the tube is not truly representing the area through which infiltration is taking place.
- 21. ▣ This is most commonly used flooding type infiltrometer. ▣ it consists of two concentric rings driven into soil uniformly without disturbing the soil to the least to a depth of 15 cm. The diameter of rings may vary between 25 cm to 60 cm. ▣ An inner ring is driven into the ground, and a second bigger ring around that to help control the flow of water through the first ring. Water is supplied either with a constant or falling head condition, and the operator records how much water infiltrates from the inner ring into the soil over a given time period.
- 24. ▣ In this a small plot of land (2m X 4m) size, is provided with a series of nozzles on the longer side with arrangements to collect and measure the surface runoff rate. The specially designed nozzles produce raindrops falling from height of 2m and capable of producing various intensities of rainfall. Experiments are conducted under controlled conditions with various combinations of intensities and durations and the surface runoff rates and volumes are measured in each case. Using the water budget equation infiltration rate and its variation with time are estimate. ▣ P = Precipitation, R = Surface runoff, G = net ground water flow, E = Evaporation, T = Transpiration, ∆S= change in storage P –P R– R––GG ––EE- T- T= ∆=S ∆S
- 25. ▣ plot of land (2m X 4m) ▣ The specially designed nozzles produce raindrops falling from height of 2m ▣ under controlled conditions with various combinations of intensities & durations and the ▣ surface runoff rates and volumes are measured in each case. P – R – G – E - T = ∆S
- 28. ▣ The infiltration rate is the velocity or speed at which water enters into the soil. ▣ It is usually measured by the depth (mm) of the water layer that can enter the soil in one hour Or ▣ rate at which water enters the soil at the surface. It is denoted by f(t). ▣ CUMULATIVE INFILTRATION :- Accumulated depth of water infiltrating during given time period. It is denoted by F(t). t F ( t )   f ( t ) d t 0 d t d F f ( t ) 
- 29. ▣ INFILTRATION CAPACITY RATE CURVE as obtained from infiltrometer is essentially observed to be decaying curve (max to min) ▣ Some mathematical expressions to describe the shape of curve, given by various investigators are :- a) b) c) d) Horton’s equation Phillips equation kostiakov equation holtans equation
- 30. a) Horton’s equation : ft= Infiltration capacity(inches/hour) f0= Initial infiltration capacity. fc= Minimum infiltration capacity. t = Time since the start of rainfall. k = Constant depending upon soil type & vegetable cover. Note : fc is direct dependent upon hydraulic conductivity.
- 31. b) Phillips equation : Here a = Minimum infiltration capacity. s = Initial infiltration capacity. c) kostiakov equation: c) holtans equation : ▣ Here in above methods a & n are constants depends on soil moisture & vegetable cover F=[ a+(s/2) x t-0.5 ] F= (a x t n) F = ( afn p + fc )
- 32. ▣ For consistency in hydrological calculations, a constant value of infiltration rate for the entire storm duration is adopted. The average infiltration rate is called the INFILTRATION INDEX. ▣ The two commonly used infiltration indices are the following: o φ – index o W – index There are extremely used for the analysis of major floods when the soil is wet and the infiltration rate becomes constant.
- 33. ▣ This is defined as the rate of infiltration above which rainfall volume = runoff volume(saturation). ▣ The assum that all lo only. Φ ▣ For determ is unshaded that to the of surface runoff.
- 34. ▣ Φ – INDEX for a catchment, during a storm depends on ▣ Soil type ▣ vegetation cover ▣ Initial moisture condition ▣ Application – Estimation of flood magnitudes due to critical storms.
- 35. s oil conditions in India For the producing for flood has found relationship ▣ R = Runoff in cm from a 24 hr rainfall of intensity I (cm/hr). ▣ α = Coefficient depends upon soil type. ▣ In estimating maximum flood for design purpose , in absence of any other data , a Φ- index valueof 0.10 cm/hr can be assumed storms (C.W.C) Φ = (I - R)/24 , R = (α X I 1.2 )
- 36. ▣ This is the average infiltration rate during the time when the rainfall intensity > infiltration rate. W-index = (P – R – I a )/tf = ( F/t f ) where P = Total storm precipitation (cm) R = Total surface runoff (cm) I a = Depression and interception losses (cm) t f= Time period of runoff ( in hours) ▣ The w- index is more accurate than Φ – index because it excludes the Depression & interception.
- 37. INTERCEPTION : it is a part of water caught by the vegetation and subsequently evaporated as a) Surface flow b) Stem flow c) Evapotranspiration For a given storm, the interception loss is estimated as Ii = Si + Ki Et
- 38. Where ▣ I i = Interception loss in mm. ▣ S i = Interception storage varies from 0.25 to 1.25 mm depending on the nature of vegetation ▣ K i =Ratio of vegetal surface area to its projected area. ▣ E t = Evaporation rate in mm/h during the precipitation. ▣ t = Duration of rainfall in hours.
- 39. ▣ W-index is the refined version of Φ – INDEX. ▣ Initial losses I a are separated from total abstractions. ▣ W-index = Φ–index I a ▣ The accurate estimation of W-index is rather difficult to obtain hence Φ – index is most commonly used. ▣ Since retention rate is very low both index W & Φ are almost same.
- 40. ▣ RUNOFF :- After infiltration remaining precipitation on the surface is called runoff. OR Draining of precipitation from a catchment area through a surface channel. COMPONENTS OF RUNOFF ▣ According to source from which the flow is derived the total runoff, consist of :- Surface runoff Subsurface runoff For the practical purpose of analysis of total runoff. Direct runoff Base flow
- 42. ▣ SURFACE RUNOFF :- Surface runoff is the water flow that occurs when the soil is infiltrated to full capacity and excess water from rain , melt water, or other sources flows over the land. ▣ It is combination of overland flow and channel precipitation. ▣ SUB SURFACE RUNOFF :- Lateral movement of water occurring to the soil above the water table. It is also known as INTERFLOW. ▣ Interflow is the portion of the stream flow contributed by infiltrated water that moves laterally in the subsurface until it reaches a channel.
- 43. ▣ OVERLAND FLOW :- When excess precipitation moves over the land surfaces to reach smaller stream channel. ▣ CHANNEL PRECIPITATION :- The precipitation falling on water surface is called channel precipitation. It is also called as stream flow.
- 44. ▣ DIRECT RUNOFF :- Direct Runoff, which is composed of contributions from surface runoff and quick interflow. Unit hydrograph analysis refers only to direct runoff. ▣ BASE FLOW :- Base flow, which is composed of contributions from delayed interflow and groundwater runoff.
- 45.  Runoff area and Runoff volume from an area mainly influenced by following two factors :-  CLIMATIC FACTORS.  PHYSIOGRAPHICAL FACTORS.  Climate factors associate with characteristics which includes the  Type of precipitation.  rainfall Intensity.  rainfall Duration.  Antecedent precipitation.  Direction of storm movement.
- 46. both such ▣ Physiographic Factors includes watershed and channel characteristics, as -  Size of Watershed.  Orientation of Watershed.  slope of Watershed.  Land Use.  Soil type.  Type of drainage network.  Shape of catchment.
- 47. ▣ TYPES OF PRECIPITATION:- state of precipitation as liquid(rainfall), solid(hail) and gasseous(fog). ▣ RAINFALL INTENSITY:- Thus high intensities of rainfall yield higher runoff, where i>f (quick runoff) or i<f (slow runoff) ▣ DURATION OF RAINFALL:- directly related to the volume of runoff be cause infiltration rate of soil decreases with duration of rainfall. Therefore medium intensity rainfall even results in considerable amount of runoff if duration is longer.
- 48. ▣ DIRECTION OF PREVAILING WIND: - If the direction of prevailing wind is same as drainage system, it results in peak flow. A storm moving in the direction of stream slope produce a higher peak in shorter period of time than a storm moving in opposite direction. ▣ ANTECEDENT MOISTURE OR SOIL MOISTURE:- Magnitude of runoff yield depends upon the initial moisture present in soil at the time of rainfall. If the rain occurs after a long dry spell then infiltration rate is more, hence it contributes less runoff.
- 49. ▣ SLOPE OF WATERSHED :- It has complex effect. It controls the time of overland flow and time of concentration of rainfall. E.g. sloppy watershed results in greater runoff due to greater runoff velocity. ▣ ORIENTATION OF WATERSHED :- This affects the evaporation and transpiration losses from the area. The north or south orientation, also affects the time of melting of collected snow. ▣ LAND USE :- More vegetation ,Less runoff. Less vegetation ,More runoff.
- 50. ▣ SIZE OF WATERSHED:- A large watershed takes longer time for draining the runoff to outlet than smaller watershed. ▣ SOIL TYPE:- Infiltration rate vary with type of soil. So runoff is great affected by soil type.  Open textured soil or porous soil like sand have high infiltration rate hence less runoff.  fine grained soil and closely compacted soil such as clay have high rate of runoff & less infiltration rate.
- 51. ▣ TYPE OF DRAINAGE NETWORK – More tributaries and stream cause less overland flow and surface runoff concentrates resulting in high peaks quickly. ▣ SHAPE OF CATCHMENT :- Elongated catchment are less subjected to high runoff peaks. the numerical indices like form factor, circularity ratio, compactness coefficient will express shape of catchment quantitatively.
- 52. ▣ BASIN YIELD : Yield means to produce or gain. Gaining any product from natural resources is called Yielding. ▣ BASIN YIELD means quantity of water available from a stream at a given point over a specified duration of time. ▣ Time duration of yield would be a month longer.
- 53. ▣ Hydrological water balance equation for any basin under consideration – Q= instantaneous rate of flow from the basin. P=Total average depth of precipitation over time t E=Total evaporation and evapotranspiration from basin. ∆ S=change in storage. ⌠Q dt = P- E - ∆ S