Infograph - Cochin Port
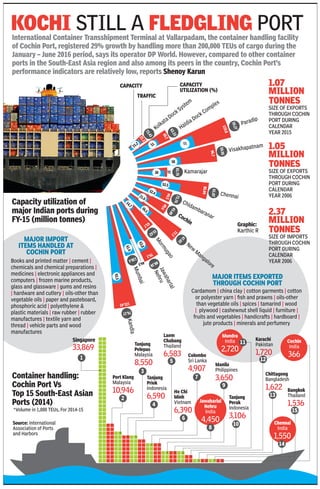
- 1. Graphic: Karthic R International Container Transshipment Terminal at Vallarpadam, the container handling âfacility of Cochin Port, registered 29% growth by handling more than 200,000 TEUs of cargo during the January â June 2016 period, says its operator DP World. However, compared to other container ports in the South-East Asia region and also among its peers in the country, Cochin Portâs performance indicators are relatively low, reports Shenoy Karun KOCHI Still a fledgling port Container handling: Cochin Port Vs Top 15 South-East Asian Ports (2014) Kandla Capacity utilization of major Indian ports during FY-15 (million tonnes) 15.2 31 58 30 52.5 32.4 21.6 36.5 14.7 63.8 61.6 92.5 71 72.43 49.7 21.1 62.33 119.8 59.27 96.7 59.95 81.76 86.04 61.07 44.5 72.76 49.6 43.49 77.7 47.02 43.7 33.62 79.3 80.38 44.5 138.4 121.43 76.17 37 Kolkata Dock System Haldia Dock Complex Paradip Visakhapatnam Kamarajar Chennai Chidambaranar New M angalore Mormugao Jawaharlal Nehru Mumbai Cochin Capacity traffic Capacity Utilization (%) Port Klang Malaysia 10,946 Tanjung Priok Indonesia 6,590 Tanjung Pelepas Malaysia 8,550 Laem Chabang Thailand 6,583 Bangkok Thailand 1,536 Karachi Pakistan 1,720 Ho Chi Minh Vietnam 6,390 Colombo Sri Lanka 4,907 Manila Philippines 3,650 Tanjung Perak Indonesia 3,106 Chittagong Bangladesh 1,622 2 4 6 9 7 13 15 10 3 5 121 Cochin India 366 Mundra India 2,720 Chennai India 1,550 14 Jawaharlal Nehru India 4,450 8 11 1.07 million tonnes Size of exports through Cochin Port during calendar year 2015 1.05 million tonnes Size of exports through Cochin Port during calendar year 2006 2.37 million tonnes Size of imports through Cochin Port during calendar year 2006Books and printed matter | cement | chemicals and chemical preparations | medicines | electronic appliances and computers | frozen marine products, glass and glassware | gums and resins | hardware and cutlery | oils-other than vegetable oils | paper and pasteboard, phosphoric acid | polyethylene & plastic materials | raw rubber | rubber manufactures | textile yarn and thread | vehicle parts and wood manufactures Singapore 33,869 Major import items handled at Cochin Port Major items exported through Cochin Port Cardamom | china clay | cotton garments | cotton or polyester yarn | fish and prawns | oils-other than vegetable oils | spices | tamarind | wood | plywood | cashewnut shell liquid | furniture | fruits and vegetables | handicrafts | hardboard | jute products | minerals and perfumery *Volume in 1,000 TEUs, For 2014-15 Source: International Association of Ports and Harbors

