Clustering Model - Insurance Claims
?Download as PPTX, PDF?
0 likes?446 views

This document discusses using k-means clustering to analyze insurance claim and coverage data to maximize company profits. It analyzes the data by segmenting customers into 5 clusters based on attributes like claim amount, coverage, income, town size, and claim type. The analysis finds that Cluster 2 has the highest claim to coverage ratio at 73% but also has higher average income and fewer customers. It is recommended the company focus on Cluster 2 markets to offer more product types, increase penetration, reduce claim ratios, and boost profits.


Clustering Model - Insurance Claims
- 1. CLUSTERING Presented by : Ashish Ranjan Vaibhav Jain
- 2. Objective of the Study O Maximize the company profits by segmenting the business according to the markets where the claim/coverage ratio is least. O To estimate the claim/coverage ratio for each clusters & focus on the income group having highest income with least product penetration.
- 3. Data Variables Explained O Claim Id O Incident Date O Claim Type : 1. Wind/Hail 2. Water Damage 3. Fire/Smoke 4.Contamination 5. Theft/Vandalism O O O O O Policy Id Coverage Income Town size Others Variables
- 6. Rapid Miner
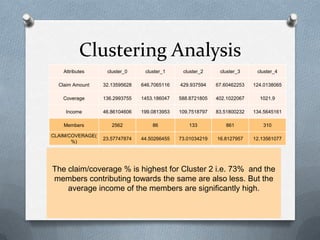
- 8. Clustering Analysis Attributes cluster_0 cluster_1 cluster_2 cluster_3 cluster_4 Claim Amount 32.13595628 646.7065116 429.937594 67.60462253 124.0138065 Coverage 136.2993755 1453.186047 588.8721805 402.1022067 1021.9 Income 46.86104606 199.0813953 109.7518797 83.51800232 134.5645161 Members 2562 86 133 861 310 CLAIM/COVERAGE( %) 23.57747874 44.50266455 73.01034219 16.8127957 12.13561077 The claim/coverage % is highest for Cluster 2 i.e. 73% and the members contributing towards the same are also less. But the average income of the members are significantly high.
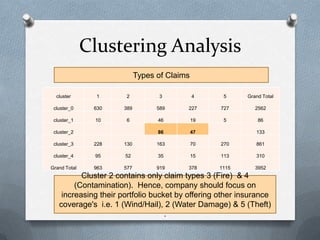
- 9. Clustering Analysis Types of Claims cluster 1 2 3 4 5 Grand Total cluster_0 630 389 589 227 727 2562 cluster_1 10 6 46 19 5 86 86 47 cluster_2 133 cluster_3 228 130 163 70 270 861 cluster_4 95 52 35 15 113 310 Grand Total 963 577 919 378 1115 3952 Cluster 2 contains only claim types 3 (Fire) & 4 (Contamination). Hence, company should focus on increasing their portfolio bucket by offering other insurance coverage's i.e. 1 (Wind/Hail), 2 (Water Damage) & 5 (Theft) .
- 10. Clustering Analysis 700 T 600 O W 500 N 400 S I Z E 1 2 300 3 200 4 100 5 0 cluster_0 cluster_1 cluster_2 cluster_3 cluster_4 CLUSTER TYPE Cluster >2.5 L (1) 50TH2.499L(2) 10TH49.99TH(3) 2.5TH9.999TH(4) <2.5TH(5) Grand Total cluster_0 668 623 518 435 318 2562 cluster_1 20 21 17 18 10 86 cluster_2 30 28 25 33 17 133 cluster_3 219 208 165 178 91 861 cluster_4 85 70 56 67 32 310 Grand Total 1022 950 781 731 468 3952
- 11. Recommendations O On the basis of analysis, we recommend to the company to concentrate on Cluster 2 markets(towns) where the average income is high & penetration of different types of insurance products are less. O Overall, by reduction in claim/coverage ratio & increased customer base will contribute towards higher profitability for the company.
- 12. THANK YOU