
![?DATA SIMILARITY AND DISSIMILARITY
We consider similarity and dissimilarity in many places in data
science.
?SIMILARITY MEASURE
It is a numerical measure of how alike two data objects are.
higher when objects are more alike.
often falls in the range [0,1]
Similarity might be used to identify,
? Duplicate data that may have differences due to typos.
? equivalent instances from different data sets. E.g. names and/or
addresses that are the same but have misspellings.
? groups of data that are very close (clusters).](https://image.slidesharecdn.com/module1-250111161328-0aea5fd5/85/INTRODUCTION-TO-DATA-ANALYTICS-MODULE-1-pptx-18-320.jpg)

INTRODUCTION TO DATA ANALYTICS -MODULE 1.pptx
- 1. Introduction to Data Analytics *MODULE 1
- 2. ?DATAANALYTICS Data analytics is a science of analyzing raw data in order to make conclusions about that information. Many of the techniques and processes of data analytics have been automated into mechanical processes and algorithms that work over raw data for human consumption. Some of the top applications for data analysis: 1) Automatically analyze survey responses with text analysis 2) Analyze customer support tickets and automatically route them 3) Examine the success of marketing campaigns 4) Predict customer churn
- 4. ? DATA Data can be defined as a systematic record of a particular quantity. It is the different values of that quantity represented together in a set. It is a collection of facts and figures to be used for a specific purpose such as a survey or analysis. When arranged in an organized form, can be called information. The source of data ( primary data, secondary data) is also an important factor. ? TYPES OF DATA Data may be qualitative or quantitative. Once you know the difference between them, you can know how to use them.
- 5. ? Qualitative Data: They represent some characteristics or attributes. They depict descriptions that may be observed but cannot be computed or calculated. For example, data on attributes such as intelligence, honesty, wisdom, cleanliness, and creativity collected using the students of your class a sample would be classified as qualitative. They are more exploratory than conclusive in nature. ? Quantitative Data: These can be measured and not simply observed. They can be numerically represented and calculations can be performed on them. For example, data on the number of students playing different sports from your class gives an estimate of how many of the total students play which sport. This information is numerical and can be classified as quantitative.
- 6. ?Quality of Data Data quality is a measure of the condition of data based on factors such as accuracy, completeness, consistency, reliability and whether it's up to date. Measuring data quality levels can help organizations identify data errors that need to be resolved and assess whether the data in their IT systems is fit to serve its intended purpose. ?SOURSES OF DATA Sources of data are of two types; 1) Statistical data 2) Non statistical data .
- 7. o Statistical Data This type of data source refers to collection of data which are used for official purposes, such as population census, official surveys, etc., o Non-Statistical Data This type of data source refers to collection of data which are used for various administrative purposes, mainly in the private sectors. ? Different Sources of Data Sources of data can also be classified based on its collection methods, which are, ? Internal Sources of Data In several cases for a certain analysis, data is collected from records, archives, and various other sources within the organization itself. Such sources data are termed as internal sources data.
- 8. Example: A school is performing an analysis to figure out the highest marks achieved in class 8 science subjects for the last 10 years. ? External Sources of Data Data may also be collected from various sources outside the organization for analytical purposes. Example: As a patient you are analysing the price chart of your nearby hospitals for treatment of ulcer.
- 9. ?DATA COLLECTION Depending on the source, it can classify as primary data or secondary data. Let us take a look at them both. ? Primary Data These are the data that are collected for the first time by an investigator for a specific purpose. Primary data are ˇ®pureˇŻ in the sense that no statistical operations have been performed on them and they are original. An example of primary data is the Census of India. ? Secondary Data They are the data that are sourced from someplace that has originally collected it. This means that this kind of data has already been collected by some researchers or investigators in the past and is available either in
- 10. published or unpublished form. This information is impure as statistical operations may have been performed on them already. An example is an information available on the Government of India, the Department of FinanceˇŻs website or in other repositories, books, journals, etc. ? DATA PROCESSING Data processing is generally, "the collection and manipulation of items of data to produce meaningful information." In this sense it can be considered a subset of information processing. In simple words, Data processing is a series of operations that use information to produce a result. Example: Telecom Billing System-It calculates the monthly charges based on
- 11. customerˇŻs service plan and the usage. This whole process is automated using a billing team tracking it. ?DATA MANAGEMENT Data management is how you extract answers and insights from raw data to meet your information needs. The proliferation of electronic data-collection methods in recent years has created the impression data management is all about technology, but its roots are firmly in accounting, statistics, and planning. Data management includes storage, data security, data sharing, data governance, data architecture, database management, and records management. Once your data management strategy is in place, youˇŻll get important insights by using your data to its full potential.
- 12. For example, A data management platform could collect customer data From multiple sources, then analyze and organize it to segment your Customers by purchase history. Data management platforms can be Housed onsite. ? DATA EXPLORATION Data exploration refers to the initial step in data analysis in which data Analysts use data visualization and statistical techniques to describe Dataset characterizations, such as size, quantity, and accuracy, in order To better understand the nature of the data. Example: Using a pie chart, Bar graph, Line graph, and another visualizers etc.
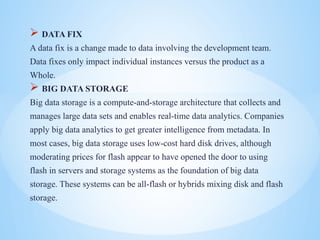
- 14. ? DATA FIX A data fix is a change made to data involving the development team. Data fixes only impact individual instances versus the product as a Whole. ? BIG DATA STORAGE Big data storage is a compute-and-storage architecture that collects and manages large data sets and enables real-time data analytics. Companies apply big data analytics to get greater intelligence from metadata. In most cases, big data storage uses low-cost hard disk drives, although moderating prices for flash appear to have opened the door to using flash in servers and storage systems as the foundation of big data storage. These systems can be all-flash or hybrids mixing disk and flash storage.
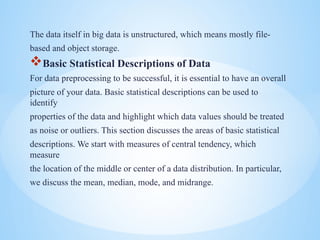
- 15. The data itself in big data is unstructured, which means mostly file- based and object storage. ?Basic Statistical Descriptions of Data For data preprocessing to be successful, it is essential to have an overall picture of your data. Basic statistical descriptions can be used to identify properties of the data and highlight which data values should be treated as noise or outliers. This section discusses the areas of basic statistical descriptions. We start with measures of central tendency, which measure the location of the middle or center of a data distribution. In particular, we discuss the mean, median, mode, and midrange.
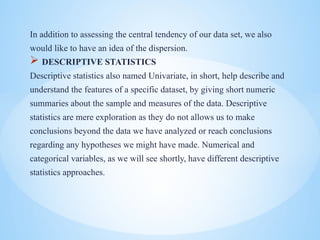
- 16. In addition to assessing the central tendency of our data set, we also would like to have an idea of the dispersion. ? DESCRIPTIVE STATISTICS Descriptive statistics also named Univariate, in short, help describe and understand the features of a specific dataset, by giving short numeric summaries about the sample and measures of the data. Descriptive statistics are mere exploration as they do not allows us to make conclusions beyond the data we have analyzed or reach conclusions regarding any hypotheses we might have made. Numerical and categorical variables, as we will see shortly, have different descriptive statistics approaches.
- 18. ?DATA SIMILARITY AND DISSIMILARITY We consider similarity and dissimilarity in many places in data science. ?SIMILARITY MEASURE It is a numerical measure of how alike two data objects are. higher when objects are more alike. often falls in the range [0,1] Similarity might be used to identify, ? Duplicate data that may have differences due to typos. ? equivalent instances from different data sets. E.g. names and/or addresses that are the same but have misspellings. ? groups of data that are very close (clusters).
- 19. Data analysis is a comprehensive method of inspecting, cleansing, transforming, and modeling data to discover useful information, draw conclusions, and support decision-making. It is a multifaceted process involving various techniques and methodologies to interpret data from various sources in different formats, both structured and unstructured. Data analysis is not just a mere process; it's a tool that empowers organizations to make informed decisions, predict trends, and improve operational efficiency. It's the backbone of strategic planning in businesses, governments, and other organizations. What is Data Analysis?
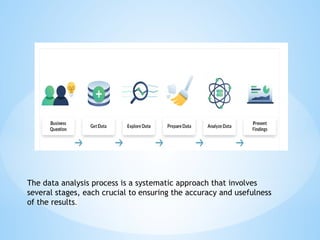
- 21. The data analysis process is a systematic approach that involves several stages, each crucial to ensuring the accuracy and usefulness of the results.
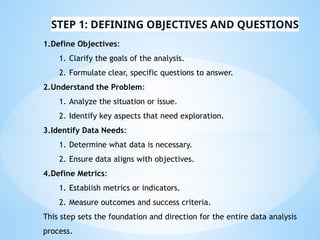
- 22. STEP 1: DEFINING OBJECTIVES AND QUESTIONS 1.Define Objectives: 1. Clarify the goals of the analysis. 2. Formulate clear, specific questions to answer. 2.Understand the Problem: 1. Analyze the situation or issue. 2. Identify key aspects that need exploration. 3.Identify Data Needs: 1. Determine what data is necessary. 2. Ensure data aligns with objectives. 4.Define Metrics: 1. Establish metrics or indicators. 2. Measure outcomes and success criteria. This step sets the foundation and direction for the entire data analysis process.
- 23. STEP 2: DATA COLLECTION ?Gather Relevant Data: Use methods like surveys, interviews, and observations. Extract data from existing databases. ?Data Types: Quantitative: Numerical data. Qualitative: Non-numerical data. ?Alignment with Objectives: Ensure data collected is relevant to the questions and objectives. Confirm data quality and reliability.
- 24. 1.Identify Errors and Inconsistencies: ? Detect inaccuracies or anomalies in the data. 2.Handle Missing Values: ? Impute missing data or remove incomplete records. 3.Remove Duplicates: ? Eliminate repeated entries. 4.Correct Errors: ? Fix incorrect data points or inconsistencies. 5.Ensure Data Quality: ? Validate and standardize formats. STEP 3: DATA CLEANING
- 25. 1.Apply Analytical Techniques: ?Use statistical and mathematical methods. 2.Discover Patterns: ?Identify trends and relationships in the data. 3.Use Tools and Software: ?Utilize Python, R, Excel, SPSS, SAS, etc. Data analysis helps uncover insights that inform decision-making and strategy. STEP 4: DATA ANALYSIS
- 26. STEP 5: DATA INTERPRETATION AND VISUALIZATION ?Interpret Results: Understand and explain the analysis outcomes. ?Create Visualizations: ?charts, graphs, and other visuals to represent data. ?Simplify Complexity: Make complex data more understandable. ?Communicate Findings: ?Provide a clear picture of insights for decision-making.
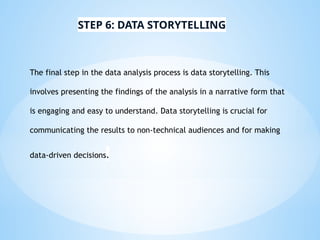
- 27. The final step in the data analysis process is data storytelling. This involves presenting the findings of the analysis in a narrative form that is engaging and easy to understand. Data storytelling is crucial for communicating the results to non-technical audiences and for making data-driven decisions. STEP 6: DATA STORYTELLING
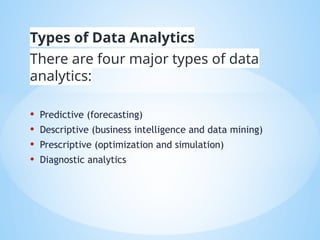
- 28. Types of Data Analytics There are four major types of data analytics: ? Predictive (forecasting) ? Descriptive (business intelligence and data mining) ? Prescriptive (optimization and simulation) ? Diagnostic analytics
- 32. ? Improved Decision Making ? Reduced Risk ? Increased Productivity ? Less Disasters ? Better Decisions
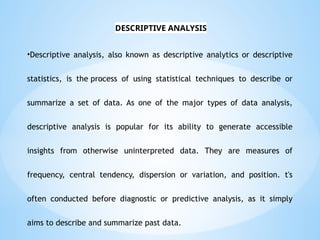
- 33. ?Descriptive analysis, also known as descriptive analytics or descriptive statistics, is the process of using statistical techniques to describe or summarize a set of data. As one of the major types of data analysis, descriptive analysis is popular for its ability to generate accessible insights from otherwise uninterpreted data. They are measures of frequency, central tendency, dispersion or variation, and position. t's often conducted before diagnostic or predictive analysis, as it simply aims to describe and summarize past data. DESCRIPTIVE ANALYSIS
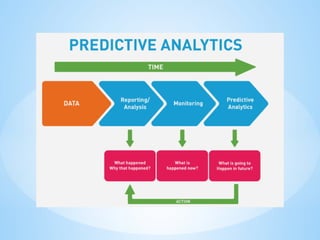
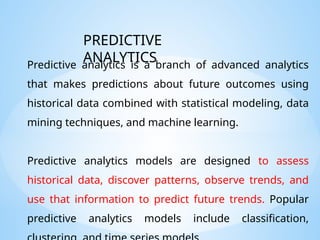
- 34. Predictive analytics is a branch of advanced analytics that makes predictions about future outcomes using historical data combined with statistical modeling, data mining techniques, and machine learning. Predictive analytics models are designed to assess historical data, discover patterns, observe trends, and use that information to predict future trends. Popular predictive analytics models include classification, PREDICTIVE ANALYTICS
- 35. Banking: Uses machine learning to predict loan defaults, assess customer risk, target lucrative clients, and detect fraudulent spending. Healthcare: Helps manage chronic illnesses and track infections like sepsis. For example, Geisinger Health created a model predicting sepsis outcomes, improving diagnosis and treatment. Human Resources: Uses analytics and surveys to match candidates, reduce turnover, and boost engagement, cutting recruitment costs and enhancing satisfaction.
- 36. ? Security ? Risk reduction ? Improved decision making ? Operational efficiency BENEFITS OF PREDICTIVE ANALYTICS
- 37. Diagnostic analytics is the process of using data to determine the causes of trends and correlations between variables. It can be viewed as a logical next step after using descriptive analytics to identify trends. Diagnostic analysis can be done manually, using an algorithm, or with statistical software (such as Microsoft Excel). Examining Market Demand Identifying Technology Issues Improving Company Culture WHAT IS DIAGNOSTIC ANALYTICS?
- 38. Prescriptive Analytics: Prescriptive analytics involves analyzing data to recommend actions by considering possible scenarios, available resources, and past and current performance. It helps in making decisions across various time frames, from immediate to long-term. Unlike descriptive analytics, which reviews outcomes post-event, prescriptive analytics proactively suggests strategies for future actions.
- 39. ?Evaluate whether a local fire department should require residents to evacuate a particular area when a wildfire is burning nearby ?Predict whether an article on a particular topic will be popular with readers based on data about searches and social shares for related topics ?Adjust a worker training program in real time based on how the worker is responding to each lesson
- 40. ? Descriptive Analytics: What happened in the past. ? Diagnostic Analytics: Examines why it might have happened. ? Predictive Analytics: Forecasts what is likely to happen in the future. ? Prescriptive Analytics: Determines the best course of action based on predictions.
- 41. Data preprocessing is crucial in the data analysis and machine learning. It involves transforming raw data into a clean and usable format. Here are the main steps involved in data preprocessing
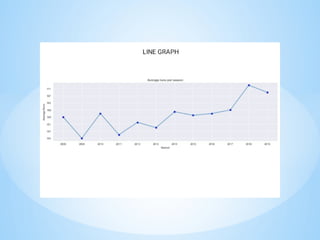
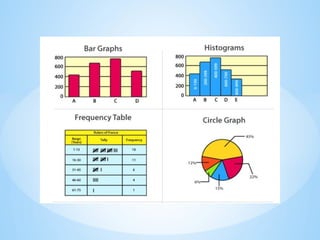
- 42. ?GRAPHICAL REPRESENTATION OF DATA It is a way of analysing numerical data. It exhibits the relation between data, ideas, information and concepts in a diagram. It is easy to understand and it is one of the most important learning strategies. It always depends on the type of information in a particular domain. There are different types of graphical representation. Some of them are as follows: ? Line Graphs ¨C Line graph or the linear graph is used to display the continuous data and it ? Bar Graphs ¨C Bar Graph is used to display the category of data and it compares the data using solid bars to represent the quantities.is useful for predicting future events over time.
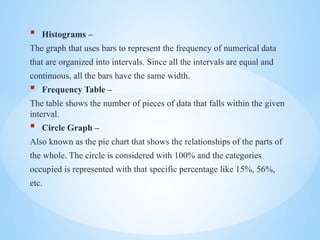
- 43. ? Histograms ¨C The graph that uses bars to represent the frequency of numerical data that are organized into intervals. Since all the intervals are equal and continuous, all the bars have the same width. ? Frequency Table ¨C The table shows the number of pieces of data that falls within the given interval. ? Circle Graph ¨C Also known as the pie chart that shows the relationships of the parts of the whole. The circle is considered with 100% and the categories occupied is represented with that specific percentage like 15%, 56%, etc.
- 46. *Thank You