Introduction to spatial data analysis in r
- 1. INTRODUCTION TO SPATIAL DATA ANALYSIS IN R Richard W Wamalwa1 - MSc., MBA(Finance), BSc. 1Directorate of Academic Quality Assurance, JKUAT ŌĆō 2011 RM 610-Environmental, Spatial, GIS, 2011
- 2. OUTLINE Installation of Sp in R Data export into R Creating spatial patterns/spatial points Changing the coordinate referencing system Creating a SpatialPointsDataframe Creating and manipulating SpatialLines objects Create the Polygon Objects References
- 3. ID x y z 1 1 1 21 2 1 2 20 3 1 3 20 4 1 4 21 5 2 3 24 6 3 2 21 7 3 6 21 8 3 7 23 9 4 1 19 10 4 3 21 11 4 4 24 12 4 7 18 13 5 6 21 14 6 2 18 15 6 7 25 16 7 3 20 17 7 5 17
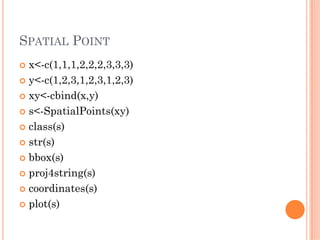
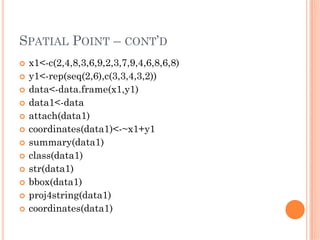
- 6. SPATIAL POINT ŌĆō CONTŌĆÖD x1<-c(2,4,8,3,6,9,2,3,7,9,4,6,8,6,8) y1<-rep(seq(2,6),c(3,3,4,3,2)) data<-data.frame(x1,y1) data1<-data attach(data1) coordinates(data1)<-~x1+y1 summary(data1) class(data1) str(data1) bbox(data1) proj4string(data1) coordinates(data1)
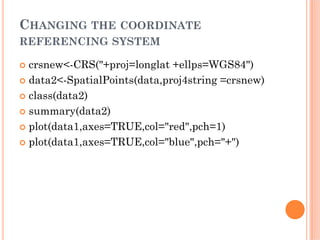
- 7. CHANGING THE COORDINATE REFERENCING SYSTEM crsnew<-CRS("+proj=longlat +ellps=WGS84") data2<-SpatialPoints(data,proj4string =crsnew) class(data2) summary(data2) plot(data1,axes=TRUE,col="red",pch=1) plot(data1,axes=TRUE,col="blue",pch="+")
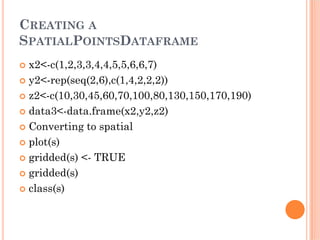
- 8. CREATING A SPATIALPOINTSDATAFRAME x2<-c(1,2,3,3,4,4,5,5,6,6,7) y2<-rep(seq(2,6),c(1,4,2,2,2)) z2<-c(10,30,45,60,70,100,80,130,150,170,190) data3<-data.frame(x2,y2,z2) Converting to spatial plot(s) gridded(s) <- TRUE gridded(s) class(s)
- 9. SPATIALPOINTSDATAFRAME ŌĆō CONTŌĆÖD summary(s) plot(s) gridded(s) <- FALSE gridded(s) class(s) # data.frame data(meuse.grid) coordinates(meuse.grid) <- ~x+y gridded(meuse.grid) <- TRUE plot(meuse.grid) # not much good summary(meuse.grid)
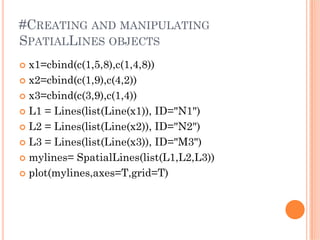
- 10. #CREATING AND MANIPULATING SPATIALLINES OBJECTS x1=cbind(c(1,5,8),c(1,4,8)) x2=cbind(c(1,9),c(4,2)) x3=cbind(c(3,9),c(1,4)) L1 = Lines(list(Line(x1)), ID="N1") L2 = Lines(list(Line(x2)), ID="N2") L3 = Lines(list(Line(x3)), ID="M3") mylines= SpatialLines(list(L1,L2,L3)) plot(mylines,axes=T,grid=T)
- 11. SPATIALLINES OBJECTS ŌĆō CONTŌĆÖD x1=cbind(rnorm(n),rnorm(n,0,0.25)) x2=cbind(rnorm(n),rnorm(n,0,0.25)) x3=cbind(rnorm(n),rnorm(n,0,0.25)) L1=Lines(list(Line(x1)),ID="mp1") L2=Lines(list(Line(x2)),ID="mp2") L3=Lines(list(Line(x3)),ID="mp3") s=SpatialLines(list(L1,L2,L3)) plot(s,axes=T)
- 12. #CREATE THE POLYGON OBJECTS #Step 1: Create the Polygon Objects Sr1 = Polygon(cbind(c(2, 4, 4, 1, 2), c(2, 3, 5, 4, 2))) Sr2 = Polygon(cbind(c(5, 4, 2, 5), c(2, 3, 2, 2))) Sr3 = Polygon(cbind(c(4, 4, 5, 10, 4), c(5, 3, 2, 5, 5))) Sr4 = Polygon(cbind(c(5, 6, 6, 5, 5), c(4, 4, 3, 3, 4)), hole = TRUE) #Step 2: Creating Srs1 = Polygons(list(Sr1), "s1") Srs2 = Polygons(list(Sr2), "s2") Srs3 = Polygons(list(Sr3, Sr4), "s3/4") #Step 3: Creating a SpatialPolygons list object SpP = SpatialPolygons(list(Srs1, Srs2, Srs3), 1:3) plot(SpP, col = 1:3, pbg = "white")
- 13. REFERENCES Gentleman, R., Hornik, K. and Parmigiani, G. (2008). Applied Spatial Data Analysis with R. ISBN 978-0-387-78170-9 e-ISBN 978-0-387- 78171-6 DOI 10.1007/978-0-387-78171-6. Thomas N O Achia (2010). Environment, Spatial statistics and GIS Notes.

