IPL Anaytics
2 likes5,878 views

An analytics project on Ball by Ball data of 9 IPL seasons to predict patterns and insights team and player wise. Apart from that a MLR model to predict the score at the end of innings.
1 of 36
Downloaded 84 times


Recommended
ipl pre assignment session
ipl pre assignment sessionvipin83607
╠²
Virat Kohli is the top contender for the Orange Cap for most runs scored, followed by Gambhir and Raina. Bhuvaneshwar Kumar has taken the most wickets for the Purple Cap. David Warner hit the most 6s in 2017 for Deccan Chargers and also hit the most 4s, followed by Gautam Gambhir. Mumbai Indians have won the most matches overall across all IPL seasons. The document also provides insights into team and match statistics such as runs scored, wins, tosses, highest totals, and biggest wins by runs and wickets for different IPL teams and seasons.Cricket predictor
Cricket predictorRajat Mittal
╠²
This document discusses predicting the outcome of cricket matches and assisting coaches. It will use algorithms like Naive Bayes and ID3 to predict matches based on factors such as home advantage, toss result, and team combination. These predictions will determine betting odds. The system will also assist coaches by selecting the best team using player records and using algorithms like Gale-Shapley to determine the optimal batting order. The document reviews several research papers on related topics and summarizes previous work on analyzing cricket matches.Cricket score and winner predictor
Cricket score and winner predictorKeyaShukla3
╠²
CRICKET SCORE AND WINNER PREDICTOR
Cricket matches are known to be tremendously exciting but also, at times, extremely unpredictable. Players are in a constant state of training to emerge triumphant in their matches. To train their teams, coaches use previous performances of their respective teams to target areas where the team needs improvement. This would entail that coaches spend a lot of hours going through video footage trying to analyze what happened and what could have happened had their tactics been different. This wastes precious time and is a major cause of inefficiency in the work-flow. Resolving this would be of tremendous help to coaches as well as their teams and would give them an edge over other teams. This project aims to optimize this process of analyzing cricket matches to change tactics and encourage teams to perform better against certain rival teams through data mining algorithms. The goal is to create a model through the Linear Regression algorithm that predicts the score of an ongoing match by giving ball-to-ball data of previous similar matches (played on the same ground, played against the same team etc as the ongoing match) and determining the chances of positive outcomes for a particular team.
Team Members:
Keya Shukla (171210033) - Group Leader
Tanika Jindal (171210056)
Srijan Gupta (171210051)
Data Set Used:
https://cricsheet.org/
Cricket Match Prediction
Cricket Match PredictionDaffodil International University
╠²
In this presentation slide, we tried to figure out Cricket Match Prediction.
Subscribe our YouTube Channel: https://www.youtube.com/thehungryprogrammer
Follow me on Facebook- https://www.facebook.com/Marufhosenshawon
Follow me on Twitter- https://twitter.com/MarufHosenShaon
Follow me on Linkedin- https://www.linkedin.com/in/marufhosenshawon/
Follow me on github- https://github.com/MarufhosenshawonIPL Match Prediction System Using Machine Learning.pptx
IPL Match Prediction System Using Machine Learning.pptxAJAman7
╠²
The document describes a presentation on developing an IPL (Indian Premier League) match winning prediction system using machine learning. It includes sections on introduction, literature survey, research gaps, problem statement, proposed methodology, experimental results and analysis, conclusions, and future scope. The presentation aims to collect IPL match data and develop a model using machine learning techniques to predict the outcome and winning probability of upcoming matches based on input data like teams, scores, overs remaining, and wickets lost.PREDICTING PLAYERS' PERFORMANCE IN ONE DAY INTERNATIONAL CRICKET MATCHES USIN...
PREDICTING PLAYERS' PERFORMANCE IN ONE DAY INTERNATIONAL CRICKET MATCHES USIN...cscpconf
╠²
Player selection is one the most important tasks for any sport and cricket is no exception. The
performance of the players depends on various factors such as the opposition team, the venue,
his current form etc. The team management, the coach and the captain select 11 players for
each match from a squad of 15 to 20 players. They analyze different characteristics and the
statistics of the players to select the best playing 11 for each match. Each batsman contributes
by scoring maximum runs possible and each bowler contributes by taking maximum wickets and
conceding minimum runs. This paper attempts to predict the performance of players as how
many runs will each batsman score and how many wickets will each bowler take for both the
teams. Both the problems are targeted as classification problems where number of runs and
number of wickets are classified in different ranges. We used naïve bayes, random forest,
multiclass SVM and decision tree classifiers to generate the prediction models for both the
problems. Random Forest classifier was found to be the most accurate for both the problems.Movie recommendation project
Movie recommendation projectAbhishek Jaisingh
╠²
Machine Learning based Hybrid Recommendation System
ŌĆó Developed a Hybrid Movie Recommendation System using both Collaborative and Content-based methods
ŌĆó Used linear regression framework for determining optimal feature weights from collaborative data
ŌĆó Recommends movie with maximum similarity score of content-based data
srs for railway reservation system
srs for railway reservation systemkhushi kalaria
╠²
The document outlines the requirements for a railway reservation system. It includes sections on the overall description, functional requirements, non-functional requirements, and diagrams. The system will allow users to search for trains between destinations, select a train, review details and passengers, pay, and cancel reservations. It aims to automate the reservation process and provide 24/7 availability while meeting security, reliability, and maintainability standards. Diagrams including use case, class, and sequence diagrams will model the system functionality and interactions.Customer churn prediction in banking
Customer churn prediction in bankingBU - PG Master Computing Conference
╠²
Customer churn has become a big issue in many banks because it costs a lot more to acquire a new customer than retaining existing ones. With the use of a customer churn prediction model possible churners in a bank can be identified, and as a result the bank can take some action to prevent them from leaving. In order to set up such a model in a bank in Iceland few things have to be considered. How a churner in a bank is defined, and which variables and methods to use. We propose that a churner for that Icelandic bank should be defined as a customer who has not been active for the last three months based on the bank definition of an active customer. Behavioral and demographic variables should be used as an input for the model, and either decision tree or logistic regression used as a technique.Cricket Management System
Cricket Management SystemSohel Sarker
╠²
This document presents a project on developing a Bangladesh Cricket Management System. It includes sections on the project requirements analysis, database design, ER diagram, flow chart, and workflow. The project deliverables are listed as team management information, upcoming series fixer, international travel news, and player statistics. The project timeline includes completing the requirements, database development, and deploying the system to production. Project roles and the management of scope, time, cost, quality, resources, risk, and communication are also outlined.Ipl.ppt
Ipl.pptPRADEEP Cheekatla
╠²
The Indian Premier League (IPL) is a professional Twenty20 cricket league established in 2008. It is organized by the Board of Control for Cricket in India and features nine franchise teams. The league has experienced rapid growth in popularity and revenue, becoming one of the most lucrative cricket leagues in the world through large television and sponsorship deals. It has inspired other international T20 leagues and increased salaries for players. The IPL season typically runs from April to June over several weeks with teams playing each other in a round-robin format followed by playoffs and a final match.Stock Market Prediction
Stock Market PredictionMRIDUL GUPTA
╠²
Ability to predict direction of stock/index price accurately is crucial for market dealers or investors to maximize their profits.IPL's Opening Week Receives Over 186K Mentions
IPL's Opening Week Receives Over 186K MentionsSimplify360
╠²
This year IPL almost seems to be a hush hush game. Compared to years in the past. Lesser publicity, lesser number of ads and an uninterested audience. However, for cricket lovers, it sure does not make any difference.
That is exactly the reason why Twitter is flooded with tweets about the IPL. With 88.5% buzz on twitter alone, it sure is not a lost game!Housing price prediction
Housing price predictionAbhimanyu Dwivedi
╠²
A ppt based on predicting prices of houses. Also tells about basics of machine learning and the algorithm used to predict those prices by using regression technique.Stock Market Prediction using Machine Learning
Stock Market Prediction using Machine Learningijtsrd
╠²
Stock market prediction is a typical task to forecast the upcoming stock values. It is very difficult to forecast because of unbalanced nature of stocks. In this work, an attempt is made for prediction of stock market trend. This research aims to combine multiple existing techniques into a much more robust prediction model which can handle various scenarios in which investment can be beneficial. By combing both techniques, this prediction model can provide more accurate and flexible recommendations. However instead of using those traditional methods, we approached the problems using machine learning techniques. We tried to revolutionize the way people address data processing problems in stock market by predicting the behavior of the stocks. In fact, if we can predict how the stock will behave in the short term future we can queue up our transactions earlier and be faster than everyone else. In theory, this allows us to maximize our profit without having the need to be physically located close to the data sources. We examined three main models. Firstly we used a complete prediction using a moving average. Secondly we used a LSTM model and finally a model called ARIMA model. The only motive is to increase the accuracy of predictive the stock market price. Each of those models was applied on real stock market data and checked whether it could return profit. Subham Kumar Gupta | Dr. Bhuvana J | Dr. M N Nachappa "Stock Market Prediction using Machine Learning" Published in International Journal of Trend in Scientific Research and Development (ijtsrd), ISSN: 2456-6470, Volume-6 | Issue-3 , April 2022, URL: https://www.ijtsrd.com/papers/ijtsrd49868.pdf Paper URL: https://www.ijtsrd.com/computer-science/other/49868/stock-market-prediction-using-machine-learning/subham-kumar-gupta
final report.pdf
final report.pdfGouravSharmaAmbah
╠²
This document describes a movie recommendation system project submitted for a bachelor's degree. It includes declarations by the students, certificates, acknowledgments, and an abstract. The methodology section explains that the project uses a content-based filtering approach to recommend the top 5 most similar movies to users based on movies they search for, in order to save users time. It analyzes movie data to build a machine learning model for providing personalized movie recommendations.Customer Churn Prevention Powerpoint Presentation ║▌║▌▀Żs
Customer Churn Prevention Powerpoint Presentation ║▌║▌▀Żs║▌║▌▀ŻTeam
╠²
Introducing Customer Churn Prevention Powerpoint Presentation ║▌║▌▀Żs. Discuss various ways through which a company can manage customer churn with this PPT slide deck. Showcase methods and ways by which a company can prevent the customer from reducing their purchase of products and services. Our readily available PPT slide deck helps to present the types of customer churn, methods to handle customer attrition, the impact of successful implementation of churn management, dashboard, churn propensity model, etc. Take the assistance of customer churn management PPT slideshow to depict several ways by which a firm can experience customer churn such as when customers stop spending, churn due to product quality, etc. Showcase four stages of customer churn management which allow the company to handle customer attrition. Present how the firm can prevent customer churn by using customer churn analysis PPT infographics. You can easily highlight information about the various marketing campaigns in order to retain its customer from churning. Provide ways to prevent churn through predictive analysis by incorporating our professionally designed customer churn prediction PPT presentation. https://bit.ly/3p6AR7SMovie lens movie recommendation system
Movie lens movie recommendation systemGaurav Sawant
╠²
ŌĆó Performed memory-based collaborative filtering techniques like Cosine similarities, PearsonŌĆÖs r & model-based Matrix Factorization techniques like Alternating Least Squares (ALS) method
ŌĆó Studied the scalability of these methods on local machines & on Hadoop clusters
Fampay Case Study.pdf
Fampay Case Study.pdfujwal67
╠²
FamPay wants to launch a new product to teach kids financial literacy and responsibility by having them take over household spending. The document discusses potential spending categories kids could manage, like bills, food delivery, and movies. It also covers user research finding parents want kids to learn budgeting, while kids want help managing expenses. The proposed solution is a product that facilitates priority spending transfers to kids, while also promoting savings goals and basic investment knowledge. This would help kids gain independence and parents reduce workload, while furthering FamPay's mission of financial education.IPL business model
IPL business modelPrasanth Narisetty
╠²
The document summarizes the business model and economics of the Indian Premier League (IPL), a professional cricket league in India.
1. IPL makes money through auctioning broadcasting rights, title sponsorships, ticket sales, auctioning franchise rights, and official sponsorships. Revenue is distributed among the IPL and franchises.
2. Franchises earn income from shares of broadcasting revenue, sponsorship money, and ticket sales. They also earn revenue from in-stadium advertising, player sales, and own sponsorships. Income pays franchise fees, player costs, rent, marketing, and other expenses.
3. The economics and accounting of the IPL present challenges around distributing revenue streams and calculating taxes.Collaborative Filtering Recommendation System
Collaborative Filtering Recommendation SystemMilind Gokhale
╠²
Collaborative filtering is a technique used in recommender systems to predict a user's preferences based on other similar users' preferences. It involves collecting ratings data from users, calculating similarities between users or items, and making recommendations. Common approaches include user-user collaborative filtering, item-item collaborative filtering, and probabilistic matrix factorization. Recommender systems are evaluated both offline using metrics like MAE and RMSE, and through online user testing.BookMyShow
BookMyShowDivyaSure
╠²
This document outlines a software requirements specification for a movie and event ticketing application called BookMyShow. It describes the problem the application aims to address, which is providing users information on movies and events in their area to easily plan weekends. The document specifies requirements like allowing users to book and cancel tickets, view event details, and make payments. It includes use case diagrams and descriptions, activity diagrams, class diagrams, sequence diagrams, and other UML diagrams to illustrate the system design and functionality.1 Supervised learning
1 Supervised learningDmytro Fishman
╠²
The first lecture from the Machine Learning course series of lectures. The lecture covers basic principles of machine learning, such as the difference between supervised and unsupervised learning, several classifiers: nearest neighbour (k-NN), decision trees, random forest, major obstacles in machine learning: overfitting and the curse of dimensionality, followed by cross-validation algorithm and general ML pipeline. A link to my github (https://github.com/skyfallen/MachineLearningPracticals) with practicals that I have designed for this course in both R and Python. I can share keynote files, contact me via e-mail: dmytro.fishman@ut.ee.Machine Learning Project
Machine Learning ProjectAbhishek Singh
╠²
This document summarizes a machine learning project for Homesite to predict customer quote conversions. The team members are Jack, Harry, and Abhishek. Homesite wants to predict the likelihood of customers purchasing insurance contracts based on their quote. The training data has 261k rows and 298 predictors, while the test data has 200k rows and the same 298 columns. Some key steps included data cleaning, using gradient boosting and random forests, and calculating the AUC (area under the ROC curve) metric to evaluate model performance. The team's model achieved an AUC of 0.95, indicating it does not overfit and has little bias.Stock Market Analysis and Prediction
Stock Market Analysis and PredictionAnil Shrestha
╠²
This document describes a final year project by four students at Himalaya College of Engineering in Nepal to analyze and predict stock market prices using artificial neural networks. The project aims to develop a neural network model to forecast stock prices on the Nepal Stock Exchange. Various technical, fundamental, and statistical analysis methods are currently used to predict stock prices but with limited success due to the complex nature of financial markets. The project outlines the design of the neural network, selection of input parameters, data collection, model training and testing. The goal is to apply neural networks to help forecast stock prices in Nepal's stock market.Sentiment analysis
Sentiment analysisMakrand Patil
╠²
This is a presentation on Sentiment Analysis.It gives a brief introduction about what is sentiment analysisproject sentiment analysis
project sentiment analysissneha penmetsa
╠²
This document summarizes a dissertation submitted for the degree of Bachelor of Technology in Computer Science and Engineering. The dissertation analyzes sentiment of mobile reviews using supervised learning methods like Naive Bayes, Bag of Words, and Support Vector Machine. Five students conducted the research under the guidance of an internal guide. The document includes sections on introduction, literature survey of models used, system analysis and design including software and hardware requirements, implementation details, testing strategies and results. Screenshots of the three supervised learning methods are also provided.Telecom Churn Prediction Presentation
Telecom Churn Prediction PresentationPinintiHarishReddy
╠²
The importance of this type of research in the telecom market is to help companies make more profit.
It has become known that predicting churn is one of the most important sources of income to Telecom companies.
Hence, this research aimed to build a system that predicts the churn of customers i telecom company.
These prediction models need to achieve high AUC values. To test and train the model, the sample data is divided into 70% for training and 30% for testing.IPL Brand Valuation Report 2018
IPL Brand Valuation Report 2018Duff & Phelps
╠²
The document provides an overview of the 2018 Indian Premier League (IPL) season and brand valuation report by Duff & Phelps. Some key points:
- Star India acquired the IPL broadcast rights for $2.55 billion, putting IPL on par with major global leagues. Viewership increased under Star.
- Mumbai Indians topped the franchise brand value rankings for the third year at $113 million. The overall IPL ecosystem value grew to $6.3 billion.
- Chennai Super Kings, who returned after a two-year ban, won their third IPL title behind the leadership of MS Dhoni and a strategy focused on experienced players.
- The season saw the continued emergence of youngIPL8 Insights
IPL8 InsightsTherefore Consultancy and Services Pvt. Ltd.
╠²
#Brands today are moving on to Digital Space where there experience more versatility. This medium is definitely viral where message moves at the speed of thoughts. Under such circumstances measuring and managing Brand Communication is crucial. Brands need to keep an eye on this Digital PR. BuzzAngles a Digital PR Measuring tool helps Brand Managers understand and Map how they are perceived in this Digital Space and how they stand in terms of their CompetitionMore Related Content
What's hot (20)
Customer churn prediction in banking
Customer churn prediction in bankingBU - PG Master Computing Conference
╠²
Customer churn has become a big issue in many banks because it costs a lot more to acquire a new customer than retaining existing ones. With the use of a customer churn prediction model possible churners in a bank can be identified, and as a result the bank can take some action to prevent them from leaving. In order to set up such a model in a bank in Iceland few things have to be considered. How a churner in a bank is defined, and which variables and methods to use. We propose that a churner for that Icelandic bank should be defined as a customer who has not been active for the last three months based on the bank definition of an active customer. Behavioral and demographic variables should be used as an input for the model, and either decision tree or logistic regression used as a technique.Cricket Management System
Cricket Management SystemSohel Sarker
╠²
This document presents a project on developing a Bangladesh Cricket Management System. It includes sections on the project requirements analysis, database design, ER diagram, flow chart, and workflow. The project deliverables are listed as team management information, upcoming series fixer, international travel news, and player statistics. The project timeline includes completing the requirements, database development, and deploying the system to production. Project roles and the management of scope, time, cost, quality, resources, risk, and communication are also outlined.Ipl.ppt
Ipl.pptPRADEEP Cheekatla
╠²
The Indian Premier League (IPL) is a professional Twenty20 cricket league established in 2008. It is organized by the Board of Control for Cricket in India and features nine franchise teams. The league has experienced rapid growth in popularity and revenue, becoming one of the most lucrative cricket leagues in the world through large television and sponsorship deals. It has inspired other international T20 leagues and increased salaries for players. The IPL season typically runs from April to June over several weeks with teams playing each other in a round-robin format followed by playoffs and a final match.Stock Market Prediction
Stock Market PredictionMRIDUL GUPTA
╠²
Ability to predict direction of stock/index price accurately is crucial for market dealers or investors to maximize their profits.IPL's Opening Week Receives Over 186K Mentions
IPL's Opening Week Receives Over 186K MentionsSimplify360
╠²
This year IPL almost seems to be a hush hush game. Compared to years in the past. Lesser publicity, lesser number of ads and an uninterested audience. However, for cricket lovers, it sure does not make any difference.
That is exactly the reason why Twitter is flooded with tweets about the IPL. With 88.5% buzz on twitter alone, it sure is not a lost game!Housing price prediction
Housing price predictionAbhimanyu Dwivedi
╠²
A ppt based on predicting prices of houses. Also tells about basics of machine learning and the algorithm used to predict those prices by using regression technique.Stock Market Prediction using Machine Learning
Stock Market Prediction using Machine Learningijtsrd
╠²
Stock market prediction is a typical task to forecast the upcoming stock values. It is very difficult to forecast because of unbalanced nature of stocks. In this work, an attempt is made for prediction of stock market trend. This research aims to combine multiple existing techniques into a much more robust prediction model which can handle various scenarios in which investment can be beneficial. By combing both techniques, this prediction model can provide more accurate and flexible recommendations. However instead of using those traditional methods, we approached the problems using machine learning techniques. We tried to revolutionize the way people address data processing problems in stock market by predicting the behavior of the stocks. In fact, if we can predict how the stock will behave in the short term future we can queue up our transactions earlier and be faster than everyone else. In theory, this allows us to maximize our profit without having the need to be physically located close to the data sources. We examined three main models. Firstly we used a complete prediction using a moving average. Secondly we used a LSTM model and finally a model called ARIMA model. The only motive is to increase the accuracy of predictive the stock market price. Each of those models was applied on real stock market data and checked whether it could return profit. Subham Kumar Gupta | Dr. Bhuvana J | Dr. M N Nachappa "Stock Market Prediction using Machine Learning" Published in International Journal of Trend in Scientific Research and Development (ijtsrd), ISSN: 2456-6470, Volume-6 | Issue-3 , April 2022, URL: https://www.ijtsrd.com/papers/ijtsrd49868.pdf Paper URL: https://www.ijtsrd.com/computer-science/other/49868/stock-market-prediction-using-machine-learning/subham-kumar-gupta
final report.pdf
final report.pdfGouravSharmaAmbah
╠²
This document describes a movie recommendation system project submitted for a bachelor's degree. It includes declarations by the students, certificates, acknowledgments, and an abstract. The methodology section explains that the project uses a content-based filtering approach to recommend the top 5 most similar movies to users based on movies they search for, in order to save users time. It analyzes movie data to build a machine learning model for providing personalized movie recommendations.Customer Churn Prevention Powerpoint Presentation ║▌║▌▀Żs
Customer Churn Prevention Powerpoint Presentation ║▌║▌▀Żs║▌║▌▀ŻTeam
╠²
Introducing Customer Churn Prevention Powerpoint Presentation ║▌║▌▀Żs. Discuss various ways through which a company can manage customer churn with this PPT slide deck. Showcase methods and ways by which a company can prevent the customer from reducing their purchase of products and services. Our readily available PPT slide deck helps to present the types of customer churn, methods to handle customer attrition, the impact of successful implementation of churn management, dashboard, churn propensity model, etc. Take the assistance of customer churn management PPT slideshow to depict several ways by which a firm can experience customer churn such as when customers stop spending, churn due to product quality, etc. Showcase four stages of customer churn management which allow the company to handle customer attrition. Present how the firm can prevent customer churn by using customer churn analysis PPT infographics. You can easily highlight information about the various marketing campaigns in order to retain its customer from churning. Provide ways to prevent churn through predictive analysis by incorporating our professionally designed customer churn prediction PPT presentation. https://bit.ly/3p6AR7SMovie lens movie recommendation system
Movie lens movie recommendation systemGaurav Sawant
╠²
ŌĆó Performed memory-based collaborative filtering techniques like Cosine similarities, PearsonŌĆÖs r & model-based Matrix Factorization techniques like Alternating Least Squares (ALS) method
ŌĆó Studied the scalability of these methods on local machines & on Hadoop clusters
Fampay Case Study.pdf
Fampay Case Study.pdfujwal67
╠²
FamPay wants to launch a new product to teach kids financial literacy and responsibility by having them take over household spending. The document discusses potential spending categories kids could manage, like bills, food delivery, and movies. It also covers user research finding parents want kids to learn budgeting, while kids want help managing expenses. The proposed solution is a product that facilitates priority spending transfers to kids, while also promoting savings goals and basic investment knowledge. This would help kids gain independence and parents reduce workload, while furthering FamPay's mission of financial education.IPL business model
IPL business modelPrasanth Narisetty
╠²
The document summarizes the business model and economics of the Indian Premier League (IPL), a professional cricket league in India.
1. IPL makes money through auctioning broadcasting rights, title sponsorships, ticket sales, auctioning franchise rights, and official sponsorships. Revenue is distributed among the IPL and franchises.
2. Franchises earn income from shares of broadcasting revenue, sponsorship money, and ticket sales. They also earn revenue from in-stadium advertising, player sales, and own sponsorships. Income pays franchise fees, player costs, rent, marketing, and other expenses.
3. The economics and accounting of the IPL present challenges around distributing revenue streams and calculating taxes.Collaborative Filtering Recommendation System
Collaborative Filtering Recommendation SystemMilind Gokhale
╠²
Collaborative filtering is a technique used in recommender systems to predict a user's preferences based on other similar users' preferences. It involves collecting ratings data from users, calculating similarities between users or items, and making recommendations. Common approaches include user-user collaborative filtering, item-item collaborative filtering, and probabilistic matrix factorization. Recommender systems are evaluated both offline using metrics like MAE and RMSE, and through online user testing.BookMyShow
BookMyShowDivyaSure
╠²
This document outlines a software requirements specification for a movie and event ticketing application called BookMyShow. It describes the problem the application aims to address, which is providing users information on movies and events in their area to easily plan weekends. The document specifies requirements like allowing users to book and cancel tickets, view event details, and make payments. It includes use case diagrams and descriptions, activity diagrams, class diagrams, sequence diagrams, and other UML diagrams to illustrate the system design and functionality.1 Supervised learning
1 Supervised learningDmytro Fishman
╠²
The first lecture from the Machine Learning course series of lectures. The lecture covers basic principles of machine learning, such as the difference between supervised and unsupervised learning, several classifiers: nearest neighbour (k-NN), decision trees, random forest, major obstacles in machine learning: overfitting and the curse of dimensionality, followed by cross-validation algorithm and general ML pipeline. A link to my github (https://github.com/skyfallen/MachineLearningPracticals) with practicals that I have designed for this course in both R and Python. I can share keynote files, contact me via e-mail: dmytro.fishman@ut.ee.Machine Learning Project
Machine Learning ProjectAbhishek Singh
╠²
This document summarizes a machine learning project for Homesite to predict customer quote conversions. The team members are Jack, Harry, and Abhishek. Homesite wants to predict the likelihood of customers purchasing insurance contracts based on their quote. The training data has 261k rows and 298 predictors, while the test data has 200k rows and the same 298 columns. Some key steps included data cleaning, using gradient boosting and random forests, and calculating the AUC (area under the ROC curve) metric to evaluate model performance. The team's model achieved an AUC of 0.95, indicating it does not overfit and has little bias.Stock Market Analysis and Prediction
Stock Market Analysis and PredictionAnil Shrestha
╠²
This document describes a final year project by four students at Himalaya College of Engineering in Nepal to analyze and predict stock market prices using artificial neural networks. The project aims to develop a neural network model to forecast stock prices on the Nepal Stock Exchange. Various technical, fundamental, and statistical analysis methods are currently used to predict stock prices but with limited success due to the complex nature of financial markets. The project outlines the design of the neural network, selection of input parameters, data collection, model training and testing. The goal is to apply neural networks to help forecast stock prices in Nepal's stock market.Sentiment analysis
Sentiment analysisMakrand Patil
╠²
This is a presentation on Sentiment Analysis.It gives a brief introduction about what is sentiment analysisproject sentiment analysis
project sentiment analysissneha penmetsa
╠²
This document summarizes a dissertation submitted for the degree of Bachelor of Technology in Computer Science and Engineering. The dissertation analyzes sentiment of mobile reviews using supervised learning methods like Naive Bayes, Bag of Words, and Support Vector Machine. Five students conducted the research under the guidance of an internal guide. The document includes sections on introduction, literature survey of models used, system analysis and design including software and hardware requirements, implementation details, testing strategies and results. Screenshots of the three supervised learning methods are also provided.Telecom Churn Prediction Presentation
Telecom Churn Prediction PresentationPinintiHarishReddy
╠²
The importance of this type of research in the telecom market is to help companies make more profit.
It has become known that predicting churn is one of the most important sources of income to Telecom companies.
Hence, this research aimed to build a system that predicts the churn of customers i telecom company.
These prediction models need to achieve high AUC values. To test and train the model, the sample data is divided into 70% for training and 30% for testing.Similar to IPL Anaytics (11)
IPL Brand Valuation Report 2018
IPL Brand Valuation Report 2018Duff & Phelps
╠²
The document provides an overview of the 2018 Indian Premier League (IPL) season and brand valuation report by Duff & Phelps. Some key points:
- Star India acquired the IPL broadcast rights for $2.55 billion, putting IPL on par with major global leagues. Viewership increased under Star.
- Mumbai Indians topped the franchise brand value rankings for the third year at $113 million. The overall IPL ecosystem value grew to $6.3 billion.
- Chennai Super Kings, who returned after a two-year ban, won their third IPL title behind the leadership of MS Dhoni and a strategy focused on experienced players.
- The season saw the continued emergence of youngIPL8 Insights
IPL8 InsightsTherefore Consultancy and Services Pvt. Ltd.
╠²
#Brands today are moving on to Digital Space where there experience more versatility. This medium is definitely viral where message moves at the speed of thoughts. Under such circumstances measuring and managing Brand Communication is crucial. Brands need to keep an eye on this Digital PR. BuzzAngles a Digital PR Measuring tool helps Brand Managers understand and Map how they are perceived in this Digital Space and how they stand in terms of their CompetitionB036307011
B036307011inventionjournals
╠²
International Journal of Engineering and Science Invention (IJESI) is an international journal intended for professionals and researchers in all fields of computer science and electronics. IJESI publishes research articles and reviews within the whole field Engineering Science and Technology, new teaching methods, assessment, validation and the impact of new technologies and it will continue to provide information on the latest trends and developments in this ever-expanding subject. The publications of papers are selected through double peer reviewed to ensure originality, relevance, and readability. The articles published in our journal can be accessed online.Highest runs scorer in an ipl season
Highest runs scorer in an ipl seasonSportz Prime
╠²
This document lists the top 5 highest run scorers in a single season of the Indian Premier League (IPL). It details the player, year, team, runs scored, average, highest score, and strike rate for each of the top 5 seasons. The number one highest run scorer was Virat Kohli in 2016 for the Royal Challengers Bangalore, scoring 973 runs in 16 matches with an average of 81.08. The other top seasons were David Warner in 2016 with 848 runs, Kane Williamson in 2018 with 735 runs, Chris Gayle in 2012 with 733 runs, and Mike Hussey in 2013 with 733 runs.Columbia Presentation
Columbia PresentationTanner Crouch
╠²
The document summarizes a presentation by a University of Florida sports analytics group naming the three most valuable position players in baseball. The group conducted statistical analysis of players' performance data, salary comparisons, and risk projections to estimate each player's future surplus value over the next five seasons. They determined Mike Trout, Kris Bryant, and Corey Seager were the top three players based on their statistical profiles, contract situations, and likelihood to benefit from an increased strike zone.Sportiqo
Sportiqojackreay
╠²
Sportiqo is a blockchain based fantasy cricket app where you can trade players like stocks like a cricket stock exchange.
PERFORMANCE OF ROYAL CHALLENGERS.pptx
PERFORMANCE OF ROYAL CHALLENGERS.pptxShravanKota3
╠²
- The document discusses the statistical analysis of the performance of the Royal Challengers Bangalore cricket team in the Indian Premier League.
- It finds that RCB has a higher loss percentage than win percentage, showing their underperformance. Their success relies heavily on a few key players.
- Logistic regression is used to build a model to predict match outcomes based on wickets taken and lost, achieving up to 86% accuracy.
- While RCB remains popular, the analysis shows reasons for their inconsistent performance through overreliance on some players and statistics.IPL 8 game of brands 2015
IPL 8 game of brands 2015Therefore Consultancy and Services Pvt. Ltd.
╠²
The Digital world has given rise to a new breed of influencers, opinion leaders, critics or in some cases just a voice wanting to be heard. It is a complex world and most times replete with jargon or terms which are not easily understood. Having said that, brands are built or (sometimes) destroyed overnight as opinions or experiences are floating freely for anyone who is willing to lend an ear.
In order words the digital world is a necessary evil and listening, tracking and most importantly measuring the impact on the brand has become very crucial and complex at the same time. Making sense out of the data on a common platform is also a huge challenge.
BuzzAngles focuses on measuring what is relevant along with detailed analytics on the brand. It keeps you informed about the dynamics of the digital medium, by Monitoring, Capturing and Analyzing the information. It delivers knowledge that can be visualized and represented via web application and mobile app keeping your focus only on decision making.Dv
DvInderpreet Singh Chawla
╠²
The document analyzes NBA player performance data from the 2016-2017 season using data visualization tools. It presents 10 case studies analyzing factors like player age, offensive/defensive ratings, minutes played, points scored, shooting percentages, pace, salary, social media followers, and their impacts on winning games. The studies found that players age 27-30 generally have the highest winning percentages. Teams that pay higher salaries and have players with more well-rounded offensive and defensive skills tend to win more. Individual player impacts and pace ratings also correlate with more team wins.Buzziest IPL season this year, says Maxus Mesh report
Buzziest IPL season this year, says Maxus Mesh reportmxmindia
╠²
The document analyzes the social media buzz generated during the 2017 Indian Premier League (IPL) cricket tournament, finding that it was the most buzzed about season on record with over 6.4 million social mentions. Key findings include that Kolkata Knight Riders was the most discussed team while MS Dhoni was the most mentioned player. An analysis of brand engagement found that Vodafone's Zoo Zoo ads were the most viral sponsor content of IPL 2017.IPL
IPLMuralidharan Ramakumar
╠²
The document summarizes the Indian Premier League (IPL), a professional cricket league established in 2008. It is organized by the Board of Control for Cricket in India and follows a franchise-based model similar to American sports. Key points include that IPL introduced concepts like franchise teams owning player contracts and 'icon players', it has become a lucrative source of revenue for stakeholders, and its popularity helped establish T20 cricket as a global format.Recently uploaded (20)
Herding behavior Experimental Studies --AlisonLo
Herding behavior Experimental Studies --AlisonLoAlisonKL
╠²
My experimental studies on information cascades and herding behavior, comparing Bayesian belief updating with other behavioral heuristics that account for the observed behaviors

2024 Archive - Zsolt Nemeth web archivum
2024 Archive - Zsolt Nemeth web archivumZsolt Nemeth
╠²
The 2024 Archive the Hollywood-Actresses.Com site new years collection.
Archivate blogging, link and clipart by Gigabajtos as Nemeth Zs. Selfpublisher active many organum or media-medium, written, comment, feed about Amazon books. Plus include 5.-Yearsbook (12.-NewsLetter).
ØōźØōśØōĪØōÉØōø__Cubase Pro Crack Full Activativated 2025
ØōźØōśØōĪØōÉØōø__Cubase Pro Crack Full Activativated 2025abrishhayat858
╠²
¤ō▒¤æēDOWNLOAD LINK ¤æē¤æē https://pcsoftcrack.net/ds/ ¤æł¤æł
Cubase is a professional digital audio workstation (DAW) developed by Steinberg for music production, recording, editing, and mixing. Since its initial release in 1989, Cubase has been widely used by musicians, producers, and sound engineers across various genres. Known for its powerful features, intuitive interface, and high-quality sound engine, Cubase has remained a leading choice for both beginners and professionals in the music industry.
Ō×Ī’ĖÅ ¤īŹCOPY LINK & PASTE INTO GOOGLE ¤æē¤æē https://pcsoftcrack.net/ds/ ¤æłBEST MACHINE LEARNING INSTITUTE IS DICSITCOURSES
BEST MACHINE LEARNING INSTITUTE IS DICSITCOURSESgs5545791
╠²
Machine learning is revolutionizing the way technology interacts with data, enabling systems to learn, adapt, and make intelligent decisions without human intervention. It plays a crucial role in various industries, from healthcare and finance to automation and artificial intelligence. If you want to build a successful career in this field, joining the Best Machine Learning Institute In Rohini is the perfect step. With expert-led training, hands-on projects, and industry-recognized certifications, youŌĆÖll gain the skills needed to thrive in the AI-driven world. If you are interested, then Enroll Fast ŌĆō limited seats are available!
Scaling & Measurement, Classification, and Types
Scaling & Measurement, Classification, and Typessrikanthmrt
╠²
Scaling and Measuring usefiul for Data analysis and Research Purpose.PRGTUG: Lost in Data? Let's Chart the Way Out!
PRGTUG: Lost in Data? Let's Chart the Way Out!Stanislava Tropcheva
╠²
Prague Tableau User Group (PRGTUG) Meeting:
Lost in Data?
Let's Chart the Way Out!
27th February 2025
MTC Supply Chain Management Strategy.pptx
MTC Supply Chain Management Strategy.pptxRakshit Porwal
╠²
Strategic Cost Reduction in Medical Devices Supply Chain: Achieving Sustainable ProfitabilityGuide to Retrieval-Augmented Generation (RAG) and Contextual Augmented Genera...
Guide to Retrieval-Augmented Generation (RAG) and Contextual Augmented Genera...Doug Ortiz
╠²
This document serves as a comprehensive guide to understanding Retrieval-Augmented Generation (RAG) and Contextual Augmented Generation (CAG). These innovative AI paradigms are reshaping content generation across various sectors. We will delve into their foundational principles, explore practical use cases, outline implementation strategies, and discuss performance measurement and common pitfalls.
The Marketability of Rice Straw Yarn Among Selected Customers of Gantsilyo Guru
The Marketability of Rice Straw Yarn Among Selected Customers of Gantsilyo Gurukenyoncenteno12
╠²
IMR Paper
Updated Willow 2025 Media Deck_280225 Updated.pdf
Updated Willow 2025 Media Deck_280225 Updated.pdftangramcommunication
╠²
Updated with the edits we last spoke BhavanaThe truth behind the numbers: spotting statistical misuse.pptx
The truth behind the numbers: spotting statistical misuse.pptxandyprosser3
╠²
As a producer of official statistics, being able to define what misinformation means in relation to data and statistics is so important to us.
For our sixth webinar, we explored how we handle statistical misuse especially in the media. We were also joined by speakers from the Office for Statistics Regulation (OSR) to explain how they play an important role in investigating and challenging the misuse of statistics across government.
ev3-software-tutorial-dc terminologia en ibgles.ppt
ev3-software-tutorial-dc terminologia en ibgles.ppthectormartinez817322
╠²
en ingles esta prressetnacion es muy buena lasdla lkaskl siempreew aaslkd llasaslas as asasd lk aslk al kjal kj allks
When Models Meet Data: From ancient science to todays Artificial Intelligence...
When Models Meet Data: From ancient science to todays Artificial Intelligence...ssuserbbbef4
╠²
A presentation about Data and Machine LearningKaggle & Datathons: A Practical Guide to AI Competitions
Kaggle & Datathons: A Practical Guide to AI Competitionsrasheedsrq
╠²
Kaggle & Datathons: A Practical Guide to AI CompetitionsIPL Anaytics
- 2. TEAM HAARIS ANMOL ANIMESH ADITYA ANUNAY ŌĆŻ We Believe every team has dream of winning the ’¼ünal cup or trophy the dream becomes their goal and that goal is achieved only by planned action for unfavourable scenarios.
- 3. INDEX Introduction Season wise Analysis Player wise Analysis Team wise Analysis Model Player Rankings Player Segmentation Key Takeaway Conclusion
- 4. ŌĆŻ IPL is a professional Twenty20 cricket league in India contested during April and May of every year by teams representing Indian Cities. ŌĆŻ Founded by BCCI and it is now the most attended cricket league in the world and ranks sixth among all sports league. ŌĆŻ In 2010 ,the IPL became the ’¼ürst sporting event in the world to be broadcasted live on YouTube. QUICK FACTS
- 5. Data Consist Of ŌĆŻ Data of 9 IPL Seasons from 2008 to 2016 ŌĆŻ Ball by Ball details of 577 matches ŌĆŻ Match details ŌĆŻ Player details ŌĆŻ Season wise best performers
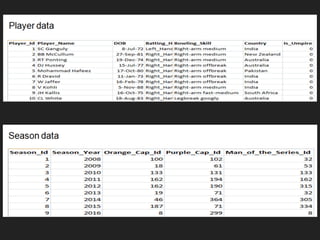
- 8. Team Data Player Match
- 9. SEASON Top 10 Batsmen in last 9 Seasons ŌĆŻ Out of top 10 batsmen 7 are Indians ŌĆŻ Rains and Kohli are on the top when it comes to scoring ŌĆŻ M S Dhoni is more consistent in scoring runs
- 10. Top 10 Batsmen on the basis of Average Runs
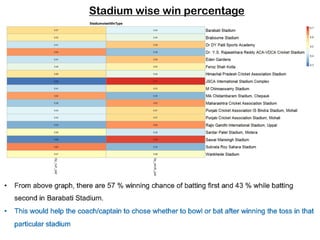
- 11. Stadium wise win percentage
- 12. PLAYER Player performance Vs Teams
- 13. TEAM Team performance across different Stadium Dark colour indicates most numbers of wins on that ground
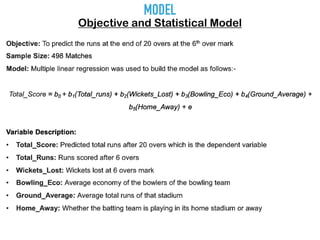
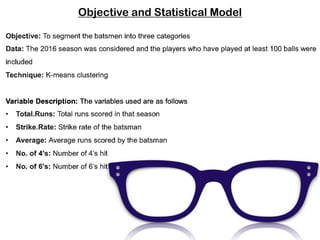
- 14. MODEL Objective and Statistical Model
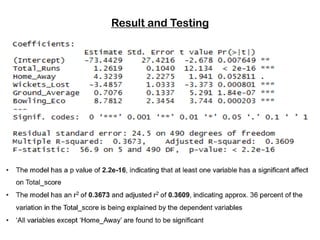
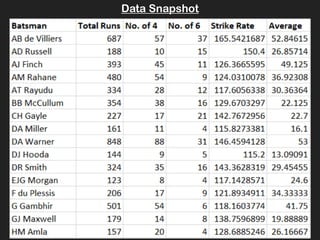
- 15. Data Snapshot
- 18. PLAYER RANKINGS
- 19. Objective and Statistical Model
- 20. Data Snapshot
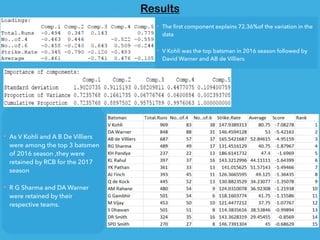
- 21. Results The ’¼ürst component explains 72.36%of the variation in the data V Kohli was the top batsman in 2016 season followed by David Warner and AB de Villiers As V Kohli and A B De Villiers were among the top 3 batsmen of 2016 season ,they were retained by RCB for the 2017 season R G Sharma and DA Warner were retained by their respective teams.
- 22. Objective and Statistical Model
- 23. DATA SNAPSHOT
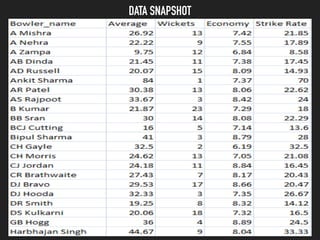
- 24. Results The ’¼ürst component explains 62.61% of the variation in the data. B Kumar was the top bowler in the 2016 season
- 26. Objective and Statistical Model
- 27. DATA SNAPSHOT
- 28. Results ŌĆŻ The cluster 3 is the one which has batsmen of the highest caliber followed by cluster 1. ŌĆŻ The cluster 2 has batsmen with lowest caliber . ŌĆŻ The R-squared is computed as ratio of Between Cluster Variability to total Variability was found to be 64.7% ŌĆŻ AB De Villiers ,Virat Kohli and David Warner belong to the 3rd cluster which can be though as the Premium players.
- 29. Objective and Statistical Model
- 30. DATA SNAPSHOT
- 31. Results ŌĆŻ The cluster 1 is the one which has bowlers of the highest caliber followed by cluster 2. ŌĆŻ The cluster 3 has bowlers with lowest caliber ŌĆŻ The R-squared is computed as ratio of Between Clusters Variability Of total Variability was found to be 64.2% ŌĆŻ As seen B Kumar, A Zampa and Y Chahal are included in cluster 1 as they were among the top 10 bowlers in 2016
- 32. KEY TAKEAWAY
- 33. DATA SNAPSHOT Data for opening batsmen for last 5 years and current 4 years . Similarly we have sliced batsman_scored data for 6th and 7th order batsman.
- 34. CONCLUSIONS Ō¢Ė The average of opening batsmen in last four season (47.79)is signi’¼ücantly higher than the ’¼ürst ’¼üve Season(41.79) . Ō¢Ė The average of middle order batsmen in last four season (21.64 )is signi’¼ücantly higher than the ’¼ürst ’¼üve Seasons (19.95). Ō¢Ė The average of lower middle order batsmen in last four season (12.76)is slightly higher than ’¼ürst ’¼üve Seasons (12.74).
- 35. WORD CLOUD