Isocuantos de producci¨®n
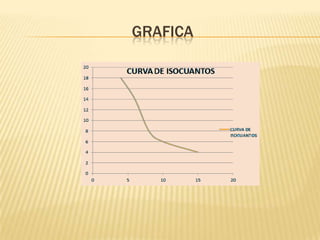
- 2. GRAFICA
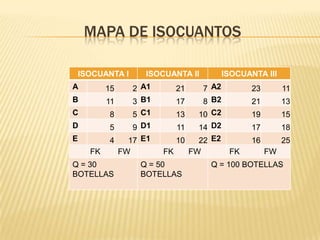
- 3. MAPA DE ISOCUANTOS ISOCUANTA I A 15 B 11 C 8 D 5 E 4 FK Q = 30 BOTELLAS ISOCUANTA II 2 A1 3 B1 21 5 C1 9 D1 13 17 E1 FW 10 17 11 FK Q = 50 BOTELLAS ISOCUANTA III 7 A2 8 B2 23 11 21 13 10 C2 14 D2 19 15 17 18 22 E2 FW 16 25 FK FW Q = 100 BOTELLAS
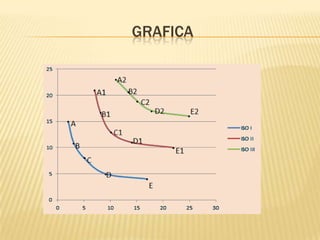
- 4. GRAFICA
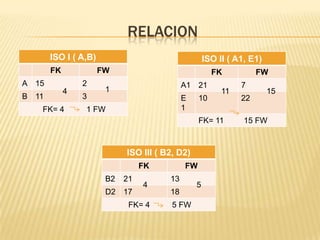
- 5. RELACION ISO I ( A,B) FK FW A 15 B 11 ISO II ( A1, E1) 2 4 FK= 4 3 FK A1 21 1 E 1 1 FW 10 11 FK= 11 ISO III ( B2, D2) FK B2 21 D2 17 4 FK= 4 FW 13 18 45 5 FW FW 7 22 15 15 FW
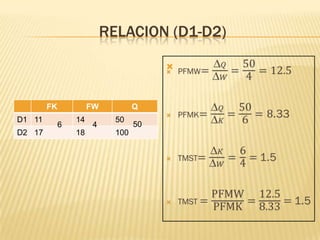
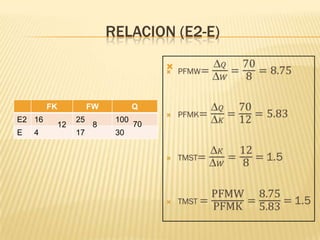
- 7. RELACION (D1-D2) ? FK D1 11 D2 17 FW 6 14 18 4 Q 50 100 50


