Kickstarter analytics
âĒ
0 likesâĒ229 views

Kickstarter data analytics. Data source from Kaggle: https://www.kaggle.com/kemical/kickstarter-projects/version/5


Kickstarter analytics
- 2. 02 Introduction Data Summary & Description The Winners Take it All Cross-time Comparison Modeling Remarks CONTENT OUTLINE
- 3. 03 INTRO Kickstarter launched in 2009 and has now become a world famous online crowdfunding platform that mainly focuses on creativity and merchandising. Creators - propose their projects and provide related information: ideas, pricing, schedule, etc. Backers - back projects that interest them Crowdfunding process:
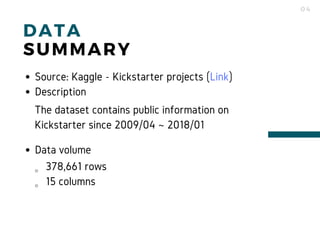
- 4. 04 DATAÂ SUMMARY Source: Kaggle - Kickstarter projects (Link) Description ã378,661 rows ã15 columns Data volume The dataset contains public information on Kickstarter since 2009/04 ~ 2018/01
- 5. 0 73,750 147,500 221,250 295,000 US GB CA AU DE 05 ââ local market dominates DATA DESCRIPTION 77% Most of the projects are from US (292,627), followed by Great Britain, Canada, Australia, and Germany REGION
- 6. DATA DESCRIPTION ââ half of the projects couldn't make it Successful 36% Others 10% Failed 53% 06 36% 36% of the projects hit their target (successful) while 53% didn't (failed) 10% were canceled or suspended SUCCESS RATE
- 7. DATA DESCRIPTION ââ wisely set the goals 07 5.7X Failed projects set their goals 5.7x higher than successful projects on average 0 13,250 26,500 39,750 53,000 Successful Failed GOAL COMPARISON
- 8. 3.4B Over USD 3.4 billion was invested in Kickstarter 88.5% belongs to successful projects 08 THE WINNERS TAKE IT ALL Successful 89% Others 4% Failed 8% PLEDGED FUND
- 9. 17X 09 0 5,750 11,500 17,250 23,000 Successful Others Failed THE WINNERS TAKE IT ALL AVERAGE PLEDGED The average pledge fund of successful projects was 17x higher than failed ones
- 10. 10 Top 5 categories attract 80% of the pledged fund 80% THE WINNERS TAKE IT ALL Games (1) 22% Design (2) 21% Technology (3) 20% Film & Video (4) 11% Music (5) 6% Others 20% CATEGORIES Â
- 11. < 15% = 0 > 1% = 1500 11 THE WINNERS TAKE IT ALL 1% 1% of the projects attract > 1,500 backers 15% of the projects attract 0 backers BACKERSÂ
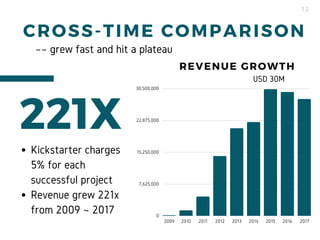
- 12. 12 0 7,625,000 15,250,000 22,875,000 30,500,000 2009 2010 2011 2012 2013 2014 2015 2016 2017 Kickstarter charges 5% for each successful project Revenue grew 221x from 2009 ~ 2017 USD 30M 221X REVENUE GROWTH ââ grew fast and hit a plateau CROSS-TIME COMPARISON
- 13. 13 Overall pledged fund Successful projects fund USD 688M 688M Over USD 687.5M were invested into Kickstarter in 2005 CROSS-TIME COMPARISON
- 14. 14 Project-counts Success rate 77,300 projects were proposed in 2015 while the success rate decrease to 27% (77300, 27%) 77K CROSS-TIME COMPARISON
- 15. 15 Backers (log) Pledged Fund (log) BACKERS & PLEDGED FUND The scatter plot illustrates data points from 2009 ~ 2018 There is a linear-like relationship between Backers & Pledged Fund MODELING
- 16. 16 1. Region - 2. Goal setting -     77% of the projects on Kickstarter are from U.S. Find local crowdfunding platform might be helpful for your project. Failed projects often set their goals too high (5.7x higher than successful ones). Referencing similar successful projects might provide some clues for goal setting. REMARKS
- 17. 17 3. Category - 4. Success Rate -     Games, Design, and Technology are the most eye-catching categories on Kickstarter. These 3 categories account for over 60% of the pledged fund on the platform. Make sure you choose the right platform! The overall success rate has risen by 10% since 2015. If you would like to start a project on it, it's about time! REMARKS
- 18. 18 ââ Most successful projects by total funds pledged #1 APPENDIX Pebble Time - Awesome Smartwatch, No Compromises (Link) Backers: 78,471 Pledged Fund: USD 20.3M (20,338,986.27) Pledged Rate: 4068%Â Creator: Pebble Technology Category: Design - Product Design
- 19. 19 ââ Most successful projects by total funds pledged #2 APPENDIX Coolest Cooler: 21st Century Cooler that's Actually Cooler (Link) Backers: 62,642 Pledged Fund: USD 13.3M (13,285,226.36) Pledged Rate: 26570%Â Creator: Ryan Grepper Category: Design - Product Design
- 20. 20 ââ Most successful projects by total funds pledged #3 APPENDIX Pebble 2, Time 2 + All-New Pebble Core (Link) Backers: 66,673 Pledged Fund: USD 12.7M (12779843.49 ) Pledged Rate: 1280%Â Creator: Pebble Technology Category: Design - Product Design