KPI_Mace_&_NonMace_WK03_20160121
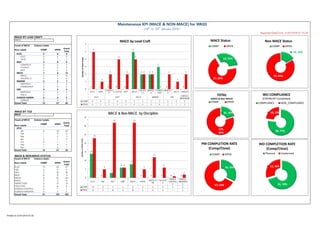
- 1. Printed on 21/01/2016 07:30 Reported Date/Time: MACE BY LEAD CRAFT MACE Y Count of WO # Column Labels Row Labels COMP OPEN Grand Total ELEC 0 6 6 ELEC 0 5 5 HVAC 0 1 1 INST 0 8 8 COMTECH 0 2 2 F-GTECH 0 4 4 INST 0 2 2 MECH 7 6 13 MECH 5 4 9 VALSPEC-C 2 2 4 MARINE 5 2 7 MARTECH 2 2 4 CRANEOPER 3 0 3 HSE 0 3 3 MARTECH 0 2 2 HSE-A 0 1 1 SUBSEA-HARDW 0 2 2 SUBSUP 0 2 2 Grand Total 12 27 39 MACE BY TCD MACE Y Count of WO # Column Labels Row Labels COMP OPEN Grand Total 2016 Jan 6 19 25 Feb 1 4 5 Mar 1 2 3 Apr 2 1 3 Jun 0 1 1 Sep 1 0 1 Nov 1 0 1 Grand Total 12 27 39 MACE & NON-MACE STATUS Count of WO # Column Labels Row Labels COMP OPEN Grand Total ELEC 14 23 37 HSE 0 5 5 INST 3 32 35 MAR 6 6 12 MECH 8 32 40 PROD 0 5 5 INSPECTION 0 12 12 FACILITIES 0 6 6 SUBSEA-CONTROL 0 1 1 SUBSEA-HARDWAR 0 2 2 Grand Total 31 124 155 Maintenance KPI (MACE & NON-MACE) for WK03 (18 th to 24 th January 2016 ) 21/01/2016 07:15:29 ELEC HVAC COMTEC H F-GTECH INST MECH VALSPE C-C MARTEC H CRANEO PER MARTEC H HSE-A SUBSUP ELEC INST MECH MARINE HSE SUBSEA- HARDWARE COMP 0 0 0 0 0 5 2 2 3 0 0 0 OPEN 5 1 2 4 2 4 2 2 0 2 1 2 0 0 0 0 0 5 2 2 3 0 0 0 5 1 2 4 2 4 2 2 0 2 1 2 0 1 2 3 4 5 6 NumberofWorkOrder MACE by Lead Craft ELEC HSE INST MAR MECH PROD INSPECTI ON FACILITIE S SUBSEA- CONTROL S SUBSEA- HARDWAR E COMP 14 0 3 6 8 0 0 0 0 0 OPEN 23 5 32 6 32 5 12 6 1 2 14 0 3 6 8 0 0 0 0 0 23 5 32 6 32 5 12 6 1 2 0 5 10 15 20 25 30 35 NumberofWorkOrder MACE & Non-MACE by Discipline 12, 31% 27, 69% MACE Status COMP OPEN 19, 16% 97, 84% Non MACE Status COMP OPEN 31, 20% 124, 80% TOTAL (MACE & Non-MACE) COMP OPEN 34, 77% 10, 23% WO COMPLIANCE (CAP/NCAP Completed) COMPLIANCE NON_COMPLIANCE 32, 32% 67, 68% PM COMPLETION RATE (Comp/Close) COMP OPEN 31, 70% 13, 30% WO COMPLETION RATE (Comp/Close) Planned Unplanned