Layerized and temporally - Digital+humanities 2010 @MIT Medialab
- 1. Layered and temporally located graphs Vincent Puig, Yves Marie L'Hour, Samuel Huron 19/05/2010 MIT HyperStudio h+digital conference
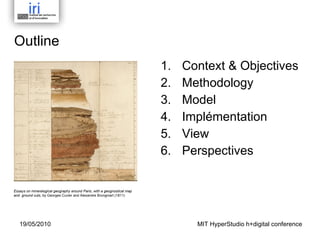
- 2. Outline Context & Objectives Methodology Model? Implémentation View Perspectives Essays on mineralogical geography around Paris, with a geognostical map and ground cuts , by Georges Cuvier and Alexandre Brongniart (1811) MIT HyperStudio h+digital conference 19/05/2010
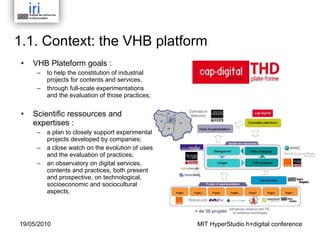
- 3. 1.1. Context: t he VHB platform VHB Plateform goals : to help the constitution of industrial projects for contents and services, through full-scale experimentations and the evaluation of those practices; Scientific ressources and expertises : a plan to closely support experimental projects developed by companies; a close watch on the evolution of uses and the evaluation of practices; an observatory on digital services, contents and practices, both present and prospective, on technological, socioeconomic and sociocultural aspects. MIT HyperStudio h+digital conference 19/05/2010
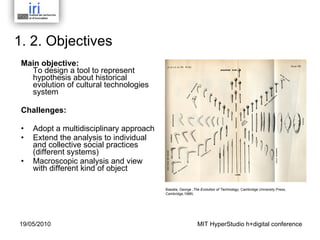
- 4. 1. 2. Objectives Main objective: To design a tool to represent hypothesis about historical evolution of cultural technologies system Challenges: Adopt a multidisciplinary approach Extend the analysis to individual and collective social practices (different systems) Macroscopic analysis and?view with different kind of object Basalla, George , The Evolution of Technology , Cambridge University Press, Cambridge,1988) MIT HyperStudio h+digital conference 19/05/2010
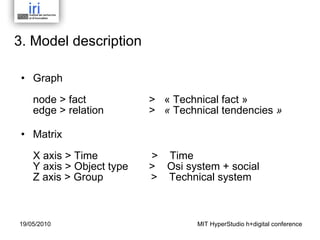
- 5. 2. Methodology Key steps: example : Identify ?? technical fact?? (commutation) Underline? ?? technical tendencies?? (decentralisation) Identify edge between ?? technical systems?? ? (telecom/audiovisuel) Key objects : technical fact ? (technic related events) technical tendancies (hypothesis relative to technic dynamics) technical system ? (system of technical fact ) caricature (draw line force of tendancies ) MIT HyperStudio h+digital conference 19/05/2010
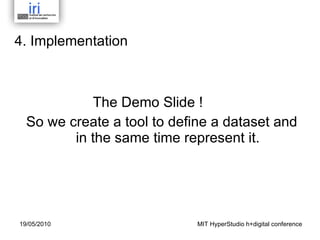
- 6. 3. Model description Graph node > fact > ? ??Technical fact??? edge > relation > ? ?? Technical tendencies? ? Matrix ? X axis > Time?? ??? ??? ??? ? ?> ?? Time Y axis > Object type > ?? Osi system + social Z axis > Group????????????????> ?? Technical system MIT HyperStudio h+digital conference 19/05/2010
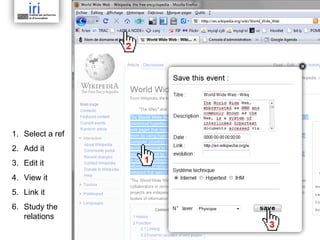
- 7. 4. Implementation The Demo 狠狠撸 ! So we create a tool to define a dataset and in the same time represent it. MIT HyperStudio h+digital conference 19/05/2010
- 8. Select a ref Add it Edit it View it Link it Study the relations
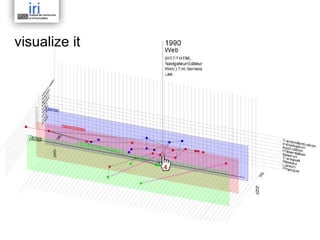
- 9. visualize it
- 10. link it
- 11. Study relations
- 12. 5. View: mainlines Matching to our data? : axe x : Time axe y : Virtualisation / transindividuation axe z: Technical systems? Respresentation means: axe x / y : graph in a chart axe z : layerization? 3d projection : orthogonal for a better view ! 12/12/10 MIT HyperStudio h+digital conference
- 13. 5. View : visualization types Combining two representations : - chart (classical, matrix ) - network diagram? ? Using :? - layerization concept - orthogonal projection to compare layer ;-) To gain benefits : - 3 view modes to compare data - one unique interface to present data and to edit graph 12/12/10 MIT HyperStudio h+digital conference
- 14. 6.1. Usage perspective Think about edge qualification (parent, tendances ...) Implement it on a social plateform for history edge analysis Emphasize evolution charasteristics? Study innovations ecosystem properties 12/12/10 MIT HyperStudio h+digital conference
- 15. 6.2. Visualization perspective Tools to analyse time-based multidimensional system? Use layerization concept for a time slice extension of classical 2D chart (next step) Manage convergences / divergences of layer (next step) 12/12/10 MIT HyperStudio h+digital conference
- 16. 6. Bibliography Basalla, Georges, The Evolution of Technology , Cambridge University Press, Cambridge ,1989 Flichy, P. L'innovation technique. Récents développements en sciences sociales, vers une nouvelle théorie de l'innovation ?La Découverte, Paris, 1995 Fry, Ben, Computational Information Design, MIT Press, Boston, 2004 Gille, Bertrand,? Histoire générale des techniques, Gallimard, Paris,1978 Leroi-Gourhan, André, L'homme et la matière, Albin Michel, Paris, 1943 Levy, Pierre, Qu’est ce que le virtuel , La Decouverte, Paris, 1998 Musso, Pierre, Les télécommunications , La Découverte, Paris, 2008 Stiegler, Bernard, Technics and Time 1 : The Fault of Epimetheus , Stanford University Press, Stanford, 1998 (1994) 19/05/2010 MIT HyperStudio h+digital conference
- 17. Thank you for your time ! Twitter @cybunk www.iri.centrepompidou.fr samuel.huron(at)cybunk.com 19/05/2010

