LCC Accounting Final (1)
1 like152 views

This document compares the financial statements of three European low-cost carriers - EasyJet, Flybe, and Jet2.com - from 2011-2015. It analyzes their balance sheets, income statements, cash flows, and key financial ratios. The document provides suggestions for each airline, such as EasyJet expanding its customer loyalty program and bases, Flybe maintaining its domestic market share, and Jet2.com developing partnerships and logistics solutions. In conclusion, the three airlines have different financial profiles but share the goal of increasing profitability.

LCC Accounting Final (1)
- 1. LOW COST CARRIER FINANCIAL STATEMENTS EASY JET ŌĆō CARAMILE FLYBE - CHIEN JET2.COM - HASSAN
- 2. AGENDA 1.Introduction - Description of easyJet/Flybe/Jet2.com 2. Comparison of Balance sheets 3. Comparison of Income Statement 4. Comparison of Cash Flow 5. Comparison of Financial Ratio 6. Suggestion 7. Conclusion
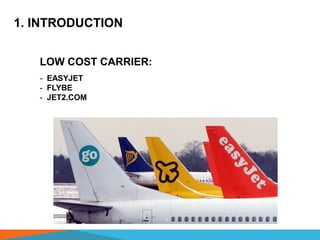
- 3. 1. INTRODUCTION LOW COST CARRIER: - EASYJET - FLYBE - JET2.COM
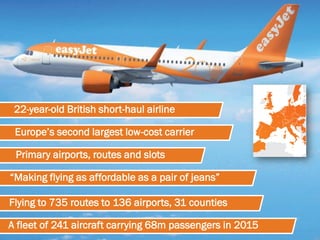
- 5. EuropeŌĆÖs second largest low-cost carrier 22-year-old British short-haul airline Primary airports, routes and slots ŌĆ£Making flying as affordable as a pair of jeansŌĆØ Flying to 735 routes to 136 airports, 31 counties A fleet of 241 aircraft carrying 68m passengers in 2015
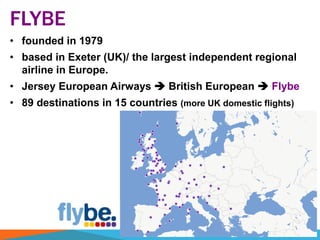
- 6. FLYBE ŌĆó founded in 1979 ŌĆó based in Exeter (UK)/ the largest independent regional airline in Europe. ŌĆó Jersey European Airways ’ā© British European ’ā© Flybe ŌĆó 89 destinations in 15 countries (more UK domestic flights)
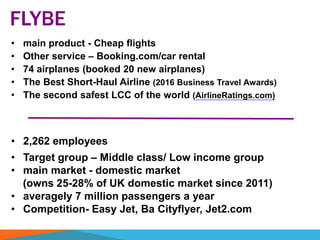
- 7. ŌĆó main product - Cheap flights ŌĆó Other service ŌĆō Booking.com/car rental ŌĆó 74 airplanes (booked 20 new airplanes) ŌĆó The Best Short-Haul Airline (2016 Business Travel Awards) ŌĆó The second safest LCC of the world (AirlineRatings.com) FLYBE ŌĆó 2,262 employees ŌĆó Target group ŌĆō Middle class/ Low income group ŌĆó main market - domestic market (owns 25-28% of UK domestic market since 2011) ŌĆó averagely 7 million passengers a year ŌĆó Competition- Easy Jet, Ba Cityflyer, Jet2.com
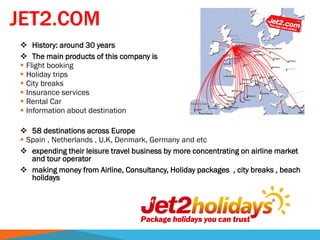
- 8. JET2.COM ’üČ History: around 30 years ’üČ The main products of this company is ’é¦ Flight booking ’é¦ Holiday trips ’é¦ City breaks ’é¦ Insurance services ’é¦ Rental Car ’é¦ Information about destination ’üČ 58 destinations across Europe ’é¦ Spain , Netherlands , U.K, Denmark, Germany and etc ’üČ expending their leisure travel business by more concentrating on airline market and tour operator ’üČ making money from Airline, Consultancy, Holiday packages , city breaks , beach holidays
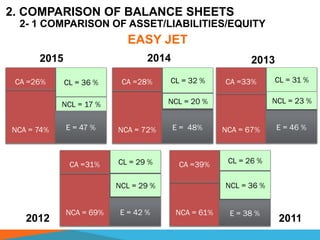
- 9. 2. COMPARISON OF BALANCE SHEETS EASY JET 2- 1 COMPARISON OF ASSET/LIABILITIES/EQUITY CA =26% NCA = 74% CL = 36 % NCL = 17 % E = 47 % 2015 CA =28% NCA = 72% CL = 32 % NCL = 20 % E = 48% CA =33% NCA = 67% CL = 31 % NCL = 23 % E = 46 % CA =31% NCA = 69% CL = 29 % NCL = 29 % E = 42 % CA =39% NCA = 61% CL = 26 % NCL = 36 % E = 38 % 2014 2013 2012 2011
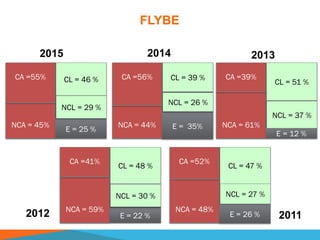
- 10. FLYBE CA =55% NCA = 45% CL = 46 % NCL = 29 % E = 25 % 2015 CA =56% NCA = 44% CL = 39 % NCL = 26 % E = 35% CA =39% NCA = 61% CL = 51 % NCL = 37 % E = 12 % CA =41% NCA = 59% CL = 48 % NCL = 30 % E = 22 % CA =52% NCA = 48% CL = 47 % NCL = 27 % E = 26 % 2014 2013 2012 2011
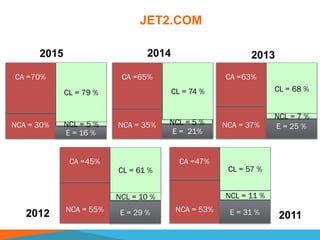
- 11. JET2.COM CA =70% NCA = 30% CL = 79 % E = 16 % NCL = 5 % 2015 CA =65% NCA = 35% CL = 74 % E = 21% CA =63% NCA = 37% CL = 68 % E = 25 % NCL = 7 % CA =45% NCA = 55% CL = 61 % E = 29 % NCL = 10 % CA =47% NCA = 53% CL = 57 % NCL = 11 % E = 31 % 2014 2013 2012 2011 NCL = 5 %
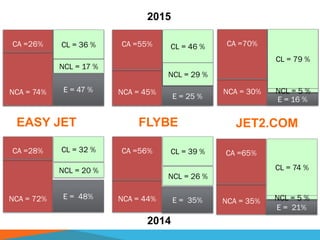
- 12. EASY JET FLYBE JET2.COM 2014 2015 CA =26% NCA = 74% CL = 36 % NCL = 17 % E = 47 % CA =28% NCA = 72% CL = 32 % NCL = 20 % E = 48% CA =56% NCA = 44% CL = 39 % NCL = 26 % E = 35% CA =55% NCA = 45% CL = 46 % NCL = 29 % E = 25 % CA =70% NCA = 30% CL = 79 % E = 16 % NCL = 5 % CA =65% NCA = 35% CL = 74 % E = 21% NCL = 5 %
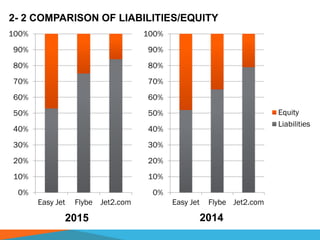
- 13. 2- 2 COMPARISON OF LIABILITIES/EQUITY 0% 10% 20% 30% 40% 50% 60% 70% 80% 90% 100% Easy Jet Flybe Jet2.com Equity Liabilities 0% 10% 20% 30% 40% 50% 60% 70% 80% 90% 100% Easy Jet Flybe Jet2.com Equity Liabilities 2015 2014
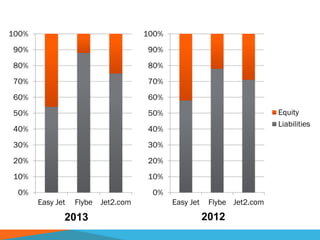
- 14. 0% 10% 20% 30% 40% 50% 60% 70% 80% 90% 100% Easy Jet Flybe Jet2.com Equity Liabilities 0% 10% 20% 30% 40% 50% 60% 70% 80% 90% 100% Easy Jet Flybe Jet2.com Equity Liabilities 20122013
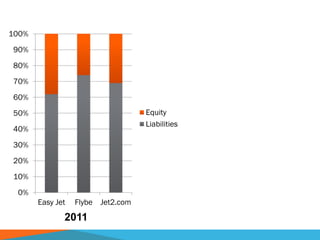
- 15. 0% 10% 20% 30% 40% 50% 60% 70% 80% 90% 100% Easy Jet Flybe Jet2.com Equity Liabilities 2011
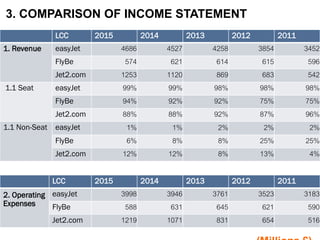
- 16. LCC 2015 2014 2013 2012 2011 1. Revenue easyJet 4686 4527 4258 3854 3452 FlyBe 574 621 614 615 596 Jet2.com 1253 1120 869 683 542 1.1 Seat easyJet 99% 99% 98% 98% 98% FlyBe 94% 92% 92% 75% 75% Jet2.com 88% 88% 92% 87% 96% 1.1 Non-Seat easyJet 1% 1% 2% 2% 2% FlyBe 6% 8% 8% 25% 25% Jet2.com 12% 12% 8% 13% 4% LCC 2015 2014 2013 2012 2011 2. Operating Expenses easyJet 3998 3946 3761 3523 3183 FlyBe 588 631 645 621 590 Jet2.com 1219 1071 831 654 516 3. COMPARISON OF INCOME STATEMENT
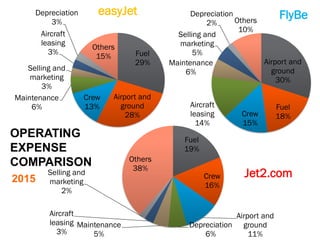
- 17. Fuel 29% Airport and ground 28% Crew 13% Maintenance 6% Selling and marketing 3% Aircraft leasing 3% Depreciation 3% Others 15% easyJet Airport and ground 30% Fuel 18%Crew 15% Aircraft leasing 14% Maintenance 6% Selling and marketing 5% Depreciation 2% Others 10% FlyBe Fuel 19% Crew 16% Airport and ground 11% Depreciation 6% Maintenance 5% Aircraft leasing 3% Selling and marketing 2% Others 38% Jet2.com OPERATING EXPENSE COMPARISON 2015
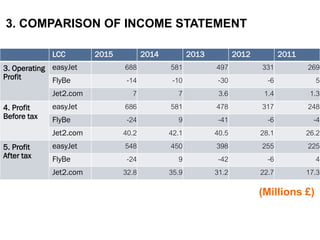
- 18. LCC 2015 2014 2013 2012 2011 3. Operating Profit easyJet 688 581 497 331 269 FlyBe -14 -10 -30 -6 5 Jet2.com 7 7 3.6 1.4 1.3 4. Profit Before tax easyJet 686 581 478 317 248 FlyBe -24 9 -41 -6 -4 Jet2.com 40.2 42.1 40.5 28.1 26.2 5. Profit After tax easyJet 548 450 398 255 225 FlyBe -24 9 -42 -6 4 Jet2.com 32.8 35.9 31.2 22.7 17.3 3. COMPARISON OF INCOME STATEMENT (Millions ┬Ż)
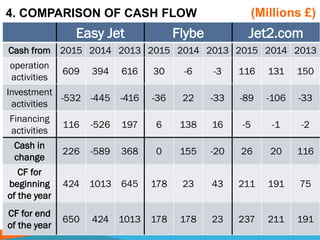
- 19. 4. COMPARISON OF CASH FLOW Easy Jet Flybe Jet2.com Cash from 2015 2014 2013 2015 2014 2013 2015 2014 2013 operation activities 609 394 616 30 -6 -3 116 131 150 Investment activities -532 -445 -416 -36 22 -33 -89 -106 -33 Financing activities 116 -526 197 6 138 16 -5 -1 -2 Cash in change 226 -589 368 0 155 -20 26 20 116 CF for beginning of the year 424 1013 645 178 23 43 211 191 75 CF for end of the year 650 424 1013 178 178 23 237 211 191 (Millions ┬Ż)
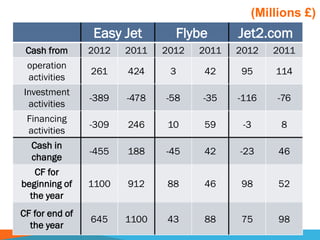
- 20. Easy Jet Flybe Jet2.com Cash from 2012 2011 2012 2011 2012 2011 operation activities 261 424 3 42 95 114 Investment activities -389 -478 -58 -35 -116 -76 Financing activities -309 246 10 59 -3 8 Cash in change -455 188 -45 42 -23 46 CF for beginning of the year 1100 912 88 46 98 52 CF for end of the year 645 1100 43 88 75 98 (Millions ┬Ż)
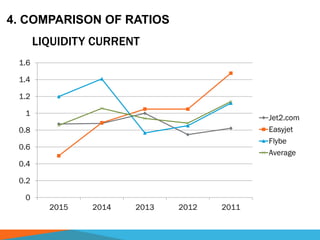
- 21. LIQUIDITY CURRENT 0 0.2 0.4 0.6 0.8 1 1.2 1.4 1.6 2015 2014 2013 2012 2011 Jet2.com Easyjet Flybe Average 4. COMPARISON OF RATIOS
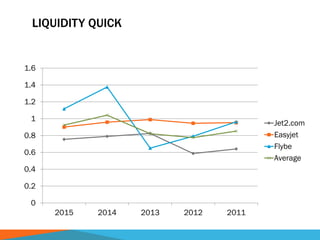
- 22. LIQUIDITY QUICK 0 0.2 0.4 0.6 0.8 1 1.2 1.4 1.6 2015 2014 2013 2012 2011 Jet2.com Easyjet Flybe Average
- 23. AVG SALES PER PESSENGER 0 10 20 30 40 50 60 70 80 90 2015 2014 2013 2012 2011 Jet2.com Easyjet Flybe Average
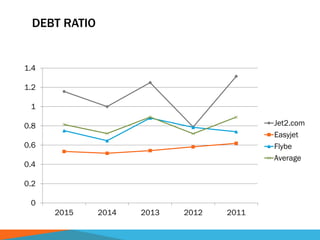
- 24. DEBT RATIO 0 0.2 0.4 0.6 0.8 1 1.2 1.4 2015 2014 2013 2012 2011 Jet2.com Easyjet Flybe Average
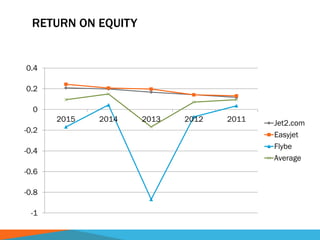
- 25. RETURN ON EQUITY -1 -0.8 -0.6 -0.4 -0.2 0 0.2 0.4 2015 2014 2013 2012 2011 Jet2.com Easyjet Flybe Average
- 26. ŌĆó Boost customer royalty program (74% returning guests) ŌĆó Strengthen digital platform ŌĆó Maintain cost advantage ŌĆó Expand new bases such as Hamburg and Amsterdam. ŌĆó Improve revenue from non-seat 6. SUGGESTION FOR
- 27. 6. SUGGESTION FOR ŌĆó Maintain the current market share ŌĆó Explore new destinations ŌĆó More capacities to make profit ŌĆó try to add more revenue in other activities (not only revenue from tickets)
- 28. 6. SUGGESTION FOR ŌĆó Develop their existing partnership and new partnership as well with other travel agencies ŌĆó Need to deliver charter flights to passenger for large range of their customers ŌĆó Must offer logistics solution all over nationŌĆÖs network of distribution outlet. ŌĆó Must offer full picking , national distribution of products that is controlled by products and storage facilities.
- 29. 6. CONCLUSION FOR EASYJET, FLYBE AND JET2.COM ŌĆó Three low cost carriers share different financial statements. - easyJet: strong balance sheet and income statement. - Flybe: leads domestic market, but with financial risk (low equity). - Jet2.com: expand product lines; however, less profit