Learner-sourced visuals
- 1. A higher level textŌĆÖs best friend
- 2. Visuals for texts On July 15, Lou and I literally stopped to smell the flowers. Who is Lou? What does ŌĆśliterallyŌĆÖ mean? What were we doing?
- 3. stop to smell the flowers literally
- 4. problematisation Higher level texts (lower too?) contain challenging concepts for students to fully grasp. ŌĆō Surface level vocabulary understanding ŌĆō Text-text-text monotony ŌĆō Main point / supporting points lost in text ŌĆō Deeper level cultural references
- 5. plan 1. Pedagogical purpose ŌĆō Decorative vs utility-based use 2. Utility-based visuals 3. Problematic issues with sourcing visuals 4. Implications of learner-sourced visuals
- 6. A higher level textŌĆÖs best friend
- 7. Illuminating a text concept with visuals ŌĆó ŌĆ£Members of the National Trust have given their support to its leadership amid claims it has Disneyfied its properties with innovations such as guides dressed in period costume.ŌĆØ (Howie & Sawer, 2010) ŌĆó ŌĆ£Can an Ancient Chinese City Pursue Preservation Without Disney-fication?ŌĆØ (Bruno, 2012) ŌĆó ŌĆ£The sterile Disneyfication process is a top-down approach advised by the then prime minister, now President Recep Tayyip Erdogan. The first stage of the Tarlabasi project designated 278 buildings in nine blocks as a renewal zone in February 2006.ŌĆØ (Tremblay, 2015) ŌĆó ŌĆ£That brings me back to the Disneyfication of Christmas. I remember watching a cartoon ŌĆō I think it was the Jetsons Christmas ŌĆō and thinking heaven help us if we do get to travel to other planets and this is the tripe we bring with us.ŌĆØ (Walker, n.d.)
- 8. What characteristics do you think of for Disney?
- 9. Visuals for texts Figure 3: Stewie tries to kill Lois (Source: Family Guy, 2007) References: Goodman, D. (Writer), & Colton, G. (Director). (2007). Lois Kills Stewie [Television series episode]. Family Guy. Los Angeles: Fox Broadcasting Company. In my paper: Figure 3 demonstrates a fight scene between Stewie and his mother, Lois. Stewie hates his mother and tries to kill her, but in this scene she is fighting back finally. This animation is very violent and unexpected for cartoon. A quick video sample: https://youtu.be/bkXuuE9kCL4
- 10. Visuals for texts Figure 4: Road to the Multiverse (Source: Family Guy, 2009) References: Wild, W. (Writer), & Colton, G. (Director). (2009). Road to the Multiverse [Television series episode]. Family Guy. Los Angeles: Fox Broadcasting Company. In my paper: In Figure 4, Stewie and his family are drawn like Disney characters in one of the universes explored in this episode. Their eyes are bright and all characters appear friendly. A quick video sample: https://youtu.be/1EFA5p4WwXQ
- 11. Visual considerations The role has the following duties: Organise information from the text graphically to help others understand it in a different way, such as: ’üČa photo that truly represent the feeling or aspect of the text ’üČa satirical cartoon (i.e. political cartoon) ’üČa timeline of relevant events ’üČa chart of information (e.g. pie chart, bar graph, line graph, etc.) ’üČan infographic
- 12. Visualiser in ARC Key considerations when selecting visuals: ’üČWhat concept in the text does the visual help explain? ’üČDoes the photo elaborate beyond vocabulary alone? ’üČWhere does the visual come from?
- 13. Do these visuals illuminate a text concept or not?
- 14. Notwithstanding the purported goal of establishing state neutrality, the proposed [Quebec] Charter of Values would not require removal of the religious symbols [except those] that are considered ŌĆ£emblematic of QuebecŌĆÖs cultural heritageŌĆØ (Leddy, 2013, para. 3).
- 15. Visuals for texts Source: http://www.ottawasun.com/2013/12/15/quebec-nationalist-group-claims-francophobia-on-the-rise/
- 16. Visuals for texts Source: http://riotwire.com/cartoon/10-faqs-on-the-quebec-charter-of-values-faq/
- 17. As towns increasingly compete with one another to attract investment, the presence of good parks, squares, gardens and other public spaces becomes a vital business and marketing tool: companies are attracted to locations that offer well- designed, well-managed public places and these in turn attract customers, employees and services (Wooley et al, 2004, pg. 3).
- 18. Visuals for texts Source: Wooley et al (2014, p. 4) Source: Wooley et al (2014, pg. 3)
- 19. Are these visuals appropriate for the chosen text?
- 20. Attempting to improve Jarvis Street ŌĆ£as a cultural corridor with an emphasis on its historical significance,ŌĆØ Toronto approved new sidewalks, trees, and curbside bicycle lanes. City cyclists declared victory even though the lanes themselves included mere painted borders and chevrons. Legally sharing the road between motorists and cyclists was in fact short-lived. Despite protests, just 18 months later, a new City council led by Mayor Rob ŌĆ£war on the carŌĆØ Ford, passed a vote by a very close margin to remove the bike lanes to the sum of $272,000 (a $186,000 difference above the cost of installation). Seburn, T. (2015). Academic Reading Circles. The round.
- 22. Implications for learner-sourcing ŌĆó Reinforces reflection on what is challenging to understand ŌĆó Practices digital literacy skills ŌĆó Promotes understanding through teaching/explaining to others ŌĆó Applies to written use of visual data
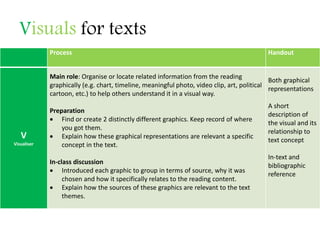
- 23. Visuals for texts Process Handout V Visualiser Main role: Organise or locate related information from the reading graphically (e.g. chart, timeline, meaningful photo, video clip, art, political cartoon, etc.) to help others understand it in a visual way. Preparation ’éĘ Find or create 2 distinctly different graphics. Keep record of where you got them. ’éĘ Explain how these graphical representations are relevant a specific concept in the text. In-class discussion ’éĘ Introduced each graphic to group in terms of source, why it was chosen and how it specifically relates to the reading content. ’éĘ Explain how the sources of these graphics are relevant to the text themes. Both graphical representations A short description of the visual and its relationship to text concept In-text and bibliographic reference
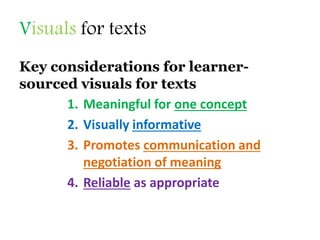
- 24. Visuals for texts Key considerations for learner- sourced visuals for texts 1. Meaningful for one concept 2. Visually informative 3. Promotes communication and negotiation of meaning 4. Reliable as appropriate
- 25. Learner-sourced Visuals When learner-sourced, accountability, literacy skills, and writing practice increase. 1. Describe whatŌĆÖs happening in the visual. 2. Connects to a text concept & refer to area of the text. 3. Explain how it improves your understanding of that text concept. 4. Cite source information in APA referencing style.
- 26. What might this visual explain? Morrison (2013, para. 15) reports that smoker can cost employers much more money and less productivity than non- smokers and he shows the truth that after Momentous Crops adopts the non-smoker policy, the cost of the health care and premiums becomes lower than before. Figure # (Cain, 2013, November 1) is about the comparison on the cost and insurance premium between smokers and non-smoker in Australia. ŌĆ” This infographic demonstrates the plenty of data on the life insurance, which is a consideration when hire a employee, and it gives a relevant evidence to prove the point that Morrison states in the text. ŌĆ”
- 27. What might this visual explain? German Speaking Population in Europe. (2014). OneEurope. Retrieved 15 April 2016, from http://one-europe.info/eurographics/german-speaking-population-in- europe Fishman (1999) uses the terms global, regional, and local languages. He suggests that trades and market communications will increase using regional languages. Figure # shows that German can be a regional language of Europe because people in neighbour countries might use it on communications more and more for business and trade.
- 28. What might this visual explain? Spichtinger (2002, p. 94- 95) argues that English as a medium of instruction programs make impact on students in universities, like Vienna. As a result, he argues that more English programs must be created. The courses can help students understand lectures and reading. In this Figure #, it demonstrates a dramatic increase, which is about SpichtingerŌĆÖs point. Neghina, C. (2016). English-Taught MasterŌĆÖs Programmes in Europe. Study Portals. Retrieved 15 April 2016, from http://www.studyportals.com/intelligence/english-taught-masters-programs-in- europe/
- 29. What might this visual explain? Figure # symbolizes the result of interracial couple in the future. Their skin tone, their eye color as well as their lip shape all suggest a that their born from a complex mixture of multiple distinctive individuals. The picture is very illustrative of how Hune-Brown (2014, p. 63) shows that TorontoŌĆÖs society in particular in moving towards a ŌĆ£one skin toned societyŌĆØ. National Geographic Determined What Americans Will Look Like in 2050, and It's Beautiful. (2014). Mic. Retrieved 15 April 2016, from http://mic.com/articles/87359/national-geographic-determined-what-americans-will- look-like-in-2050-and-it-s-beautiful#.xrRjNyPW6
- 30. Visualiser Role Academic Reading Circles Amazon $33.95 bit.ly/arc-book Info site arc.fourc.ca
- 31. Lou thanks you. Tyson Seburn tyson.seburn@utoronto.ca @seburnt / fourc.ca
Editor's Notes
- NO: The two flags, though representing Quebec and Canada, do not provide any insight into the text concept of differentiating one religious symbol from another in Quebec.
- YES: It illustrates the absurdity of suggesting Quebec cultural emblems are not religious symbols and they will achieve state neutrality by eliminating other symbols but leaving these.
- NO: the image doesnŌĆÖt really illustrate anything about public spaces or the property values section in which the image appears.
- A google map of Jarvis Street. It can show visually how itŌĆÖs situated in the city and help readers see other locations mentioned by the author in comparison. An image of what the bike lanes in question actually looked like. A satirical cartoon that demonstrates the emotion involved in these bike lanes, perhaps commenting on both sides. Obviously, we need to help students learn to search for these things effectively, reference the source of the images, and talk about HOW they help comprehension, not just pretty useless images. Jarvis Street sign is not helpful at all. Picture of bike lanes, but this isnŌĆÖt on Jarvis, or even in Toronto.
- Describe this. So letŌĆÖs look at an example text and how a visual would be helpful to clarify meaning. But letŌĆÖs start with an easier, more informal text.
- How to write about visuals for the Visualiser role


![Visuals for texts
Figure 3: Stewie tries to kill Lois (Source: Family Guy, 2007)
References:
Goodman, D. (Writer), & Colton, G. (Director). (2007). Lois Kills Stewie [Television series episode].
Family Guy. Los Angeles: Fox Broadcasting Company.
In my paper:
Figure 3 demonstrates a
fight scene between
Stewie and his mother,
Lois. Stewie hates his
mother and tries to kill
her, but in this scene she
is fighting back finally. This
animation is very violent
and unexpected for
cartoon.
A quick video sample:
https://youtu.be/bkXuuE9kCL4](https://image.slidesharecdn.com/seburn-visuals-180712144141/85/Learner-sourced-visuals-9-320.jpg)
![Visuals for texts
Figure 4: Road to the Multiverse (Source: Family Guy, 2009)
References:
Wild, W. (Writer), & Colton, G. (Director). (2009). Road to the Multiverse [Television series episode].
Family Guy. Los Angeles: Fox Broadcasting Company.
In my paper:
In Figure 4, Stewie and his
family are drawn like
Disney characters in one
of the universes explored
in this episode. Their eyes
are bright and all
characters appear friendly.
A quick video sample:
https://youtu.be/1EFA5p4WwXQ](https://image.slidesharecdn.com/seburn-visuals-180712144141/85/Learner-sourced-visuals-10-320.jpg)


![Notwithstanding the purported goal of
establishing state neutrality, the
proposed [Quebec] Charter of Values
would not require removal of the
religious symbols [except those] that
are considered ŌĆ£emblematic of
QuebecŌĆÖs cultural heritageŌĆØ (Leddy,
2013, para. 3).](https://image.slidesharecdn.com/seburn-visuals-180712144141/85/Learner-sourced-visuals-14-320.jpg)


