Les 2 - Informatie Visualisatie
- 1. Informatie visualisatie: Les 2 Joris Klerkx - Erik Duval http://hci.cs.kuleuven.be joris.klerkx@cs.kuleuven.be Human-Computer Interaction Dept. Computerwetenschappen KU Leuven 1
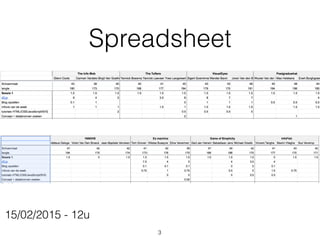
- 2. Opdracht vorige week ŌĆó Individueel: ŌĆó d3.js aanleren ŌĆó d3.js van spreadsheet als simpele case study ŌĆó kort presenteren in volgende sessie ŌĆó Spreadsheet aanvullen ŌĆó Per team: ŌĆó blog opzetten en op slack aankondigen ŌĆó Wiki pagina aanvullen ŌĆó Infovis van de week posten op blog ŌĆó (digitaal/analoog, individueel) 2
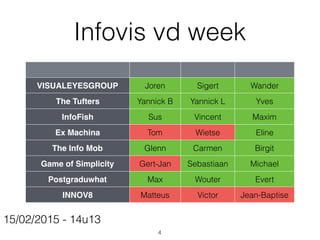
- 4. Infovis vd week VISUALEYESGROUP Joren Sigert Wander The Tufters Yannick B Yannick L Yves InfoFish Sus Vincent Maxim Ex Machina Tom Wietse Eline The Info Mob Glenn Carmen Birgit Game of Simplicity Gert-Jan Sebastiaan Michael Postgraduwhat Max Wouter Evert INNOV8 Matteus Victor Jean-Baptise 15/02/2015 - 14u13 4
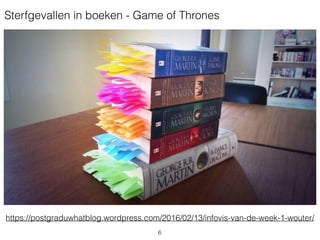
- 6. https://postgraduwhatblog.wordpress.com/2016/02/13/infovis-van-de-week-1-wouter/ Sterfgevallen in boeken - Game of Thrones 6
- 7. D3.js? 7
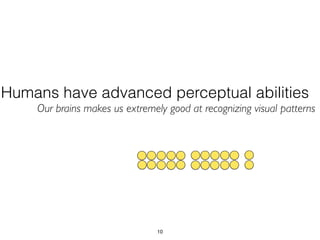
- 10. Humans have advanced perceptual abilities Our brains makes us extremely good at recognizing visual patterns 10
- 11. 11 Humans have little short term memory Our brain remembers relatively little of what we perceive. https://www.youtube.com/watch?v=IGQmdoK_ZfY&gl=BE
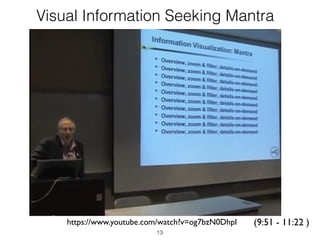
- 13. Visual Information Seeking Mantra https://www.youtube.com/watch?v=og7bzN0DhpI (9:51 - 11:22 ) 13
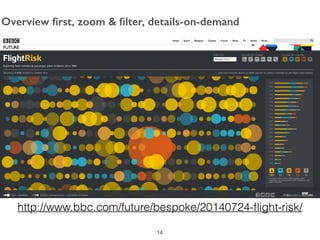
- 14. http://www.bbc.com/future/bespoke/20140724-’¼éight-risk/ Overview ’¼ürst, zoom & ’¼ülter, details-on-demand 14
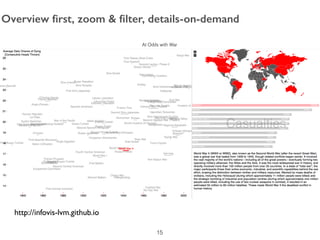
- 15. http://infovis-lvm.github.io Overview ’¼ürst, zoom & ’¼ülter, details-on-demand 15
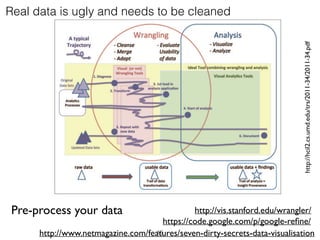
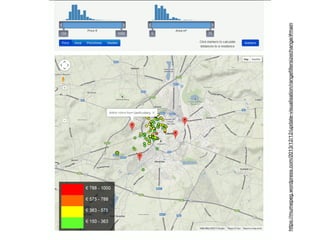
- 16. Real data is ugly and needs to be cleaned http://hcil2.cs.umd.edu/trs/2011-34/2011-34.pdf http://www.netmagazine.com/features/seven-dirty-secrets-data-visualisation https://code.google.com/p/google-re’¼üne/ http://vis.stanford.edu/wrangler/Pre-process your data 16
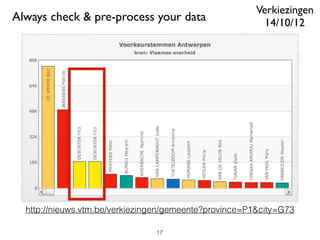
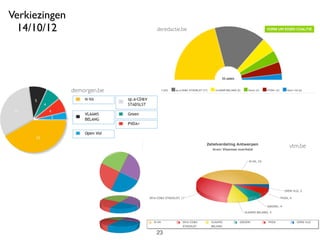
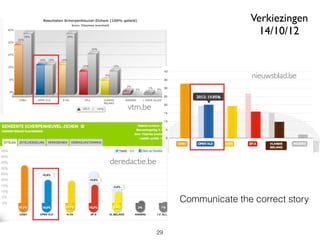
- 17. http://nieuws.vtm.be/verkiezingen/gemeente?province=P1&city=G73 Always check & pre-process your data 17 Verkiezingen 14/10/12
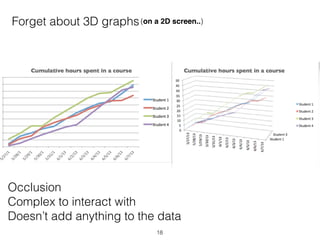
- 18. Forget about 3D graphs(on a 2D screen..) Occlusion Complex to interact with DoesnŌĆÖt add anything to the data 18
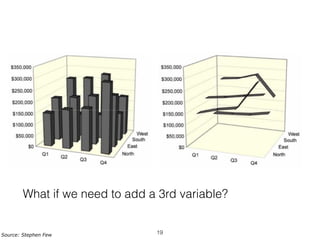
- 19. Source: Stephen Few What if we need to add a 3rd variable? 19
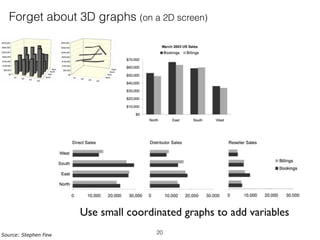
- 20. Use small coordinated graphs to add variables 20 Forget about 3D graphs (on a 2D screen) Source: Stephen Few
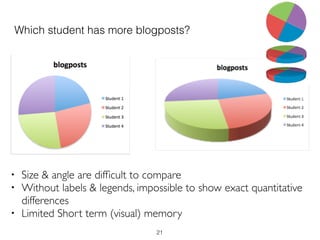
- 21. Which student has more blogposts? ŌĆó Size & angle are dif’¼ücult to compare ŌĆó Without labels & legends, impossible to show exact quantitative differences ŌĆó Limited Short term (visual) memory 21
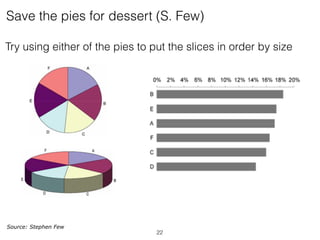
- 22. Source: Stephen Few Save the pies for dessert (S. Few) Try using either of the pies to put the slices in order by size 22
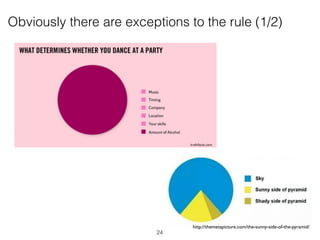
- 24. Obviously there are exceptions to the rule (1/2) 24 http://themetapicture.com/the-sunny-side-of-the-pyramid/
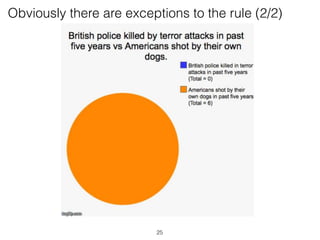
- 25. Obviously there are exceptions to the rule (2/2) 25
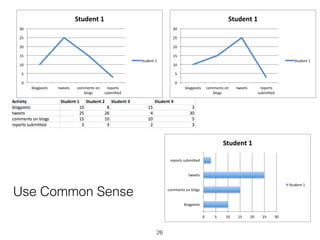
- 26. 0" 5" 10" 15" 20" 25" 30" blogposts" tweets" comments"on" blogs" reports" submi6ed" Student'1' Student"1" 0" 5" 10" 15" 20" 25" 30" blogposts" comments"on"blogs" tweets" reports"submi6ed" Student'1' Student"1" Use Common Sense 0" 5" 10" 15" 20" 25" 30" blogposts" comments"on" blogs" tweets" reports" submi6ed" Student'1' Student"1" 26
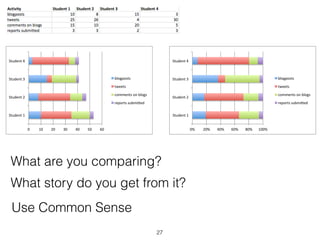
- 27. 0" 10" 20" 30" 40" 50" 60" Student"1" Student"2" Student"3" Student"4" blogposts" tweets" comments"on"blogs" reports"submi:ed" 0%# 20%# 40%# 60%# 80%# 100%# Student#1# Student#2# Student#3# Student#4# blogposts# tweets# comments#on#blogs# reports#submi;ed# Use Common Sense What are you comparing? What story do you get from it? 27
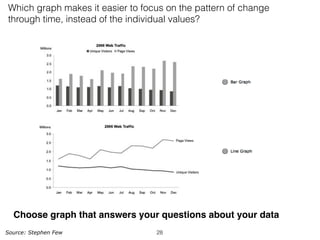
- 28. Which graph makes it easier to focus on the pattern of change through time, instead of the individual values? Choose graph that answers your questions about your data 28Source: Stephen Few
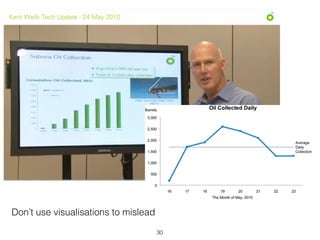
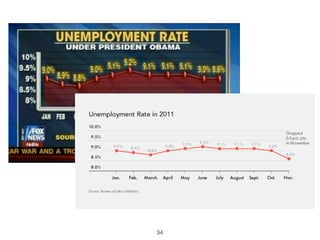
- 30. DonŌĆÖt use visualisations to mislead 30
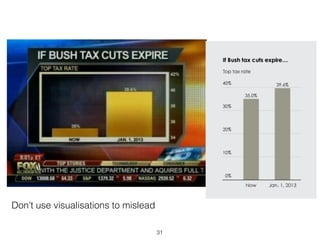
- 31. DonŌĆÖt use visualisations to mislead 31
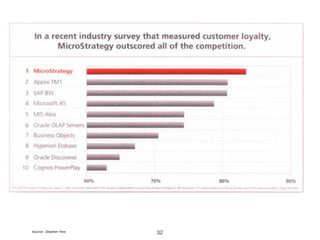
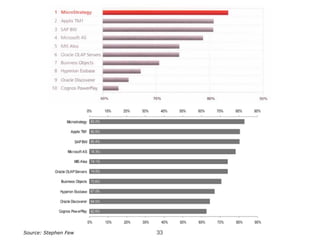
- 33. Source: Stephen Few 33
- 34. 34
- 35. ? 35
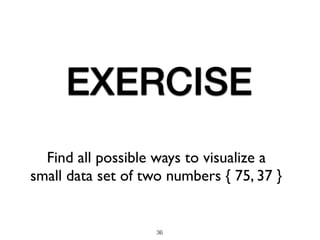
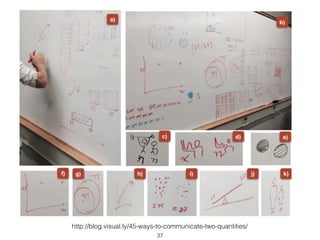
- 36. EXERCISE Find all possible ways to visualize a small data set of two numbers { 75, 37 } 36
- 39. ? 39
- 41. Maak eenŌĆ© interactieve visualisatieŌĆ© van gegevens of informatieŌĆ© met toegevoegde waarde 41
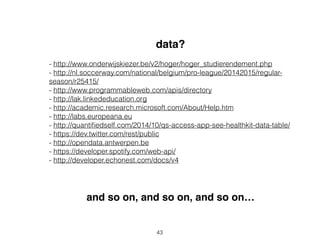
- 43. data? - http://www.onderwijskiezer.be/v2/hoger/hoger_studierendement.php - http://nl.soccerway.com/national/belgium/pro-league/20142015/regular- season/r25415/ - http://www.programmableweb.com/apis/directory - http://lak.linkededucation.org - http://academic.research.microsoft.com/About/Help.htm - http://labs.europeana.eu - http://quanti’¼üedself.com/2014/10/qs-access-app-see-healthkit-data-table/ - https://dev.twitter.com/rest/public - http://opendata.antwerpen.be - https://developer.spotify.com/web-api/ - http://developer.echonest.com/docs/v4 and so on, and so on, and so onŌĆ” 43
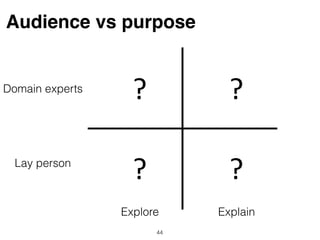
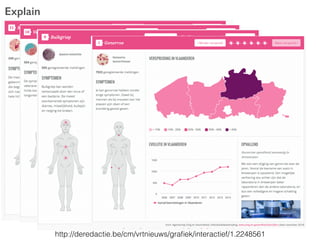
- 44. Audience vs purpose Explore Explain Lay person Domain experts ? ? ? ? 44
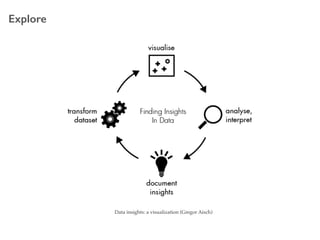
- 45. Explore Data insights: a visualization (Gregor Aisch)
- 50. Tegen volgende week ŌĆó Individueel: ŌĆó Spreadsheet aanvullen ŌĆó Infovis van de week ŌĆó Per team: ŌĆó Blogpost - oefening 75 - 37 ( scan met visualisaties/ wat geleerd) ŌĆó Publiek - Data - Verhaal ŌĆó Data - ruwe feasibility (eg omvang/formaat/etc. ) ŌĆó Visuele alternatieven (sketches) ŌĆó 10 minuten slot om te presenteren / 5 minuten feedback 50
- 51. ? 51

