Lesson plan
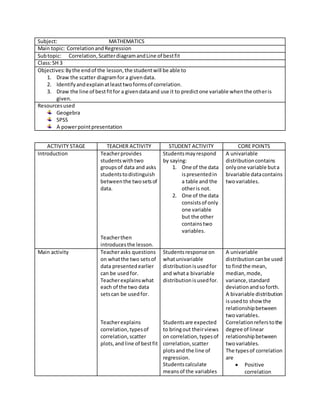
- 1. Subject: MATHEMATICS Main topic: CorrelationandRegression Subtopic: Correlation,ScatterdiagramandLine of bestfit Class:SH 3 Objectives:Bythe endof the lesson,the studentwill be able to 1. Draw the scatter diagramfor a givendata. 2. Identifyandexplainatleasttwoformsof correlation. 3. Draw the line of bestfitfor a givendataand use it to predictone variable whenthe otheris given. Resourcesused Geogebra SPSS A powerpointpresentation ACTIVITY STAGE TEACHER ACTIVITY STUDENT ACTIVITY CORE POINTS Introduction Teacherprovides studentswithtwo groupsof data and asks studentstodistinguish betweenthe twosetsof data. Teacherthen introducesthe lesson. Studentsmayrespond by saying: 1. One of the data ispresentedin a table and the otheris not. 2. One of the data consistsof only one variable but the other containstwo variables. A univariable distributioncontains onlyone variable buta bivariable datacontains twovariables. Main activity Teacherasks questions on whatthe two setsof data presentedearlier can be usedfor. Teacherexplainswhat each of the two data setscan be usedfor. Teacherexplains correlation,typesof correlation, scatter plots,and line of bestfit Studentsresponse on whatunivariable distributionisusedfor and whata bivariable distributionisusedfor. Studentsare expected to bringout theirviews on correlation, typesof correlation,scatter plotsand the line of regression. Studentscalculate meansof the variables A univariable distributioncanbe used to findthe mean, median,mode, variance,standard deviationandsoforth. A bivariable distribution isusedto show the relationshipbetween twovariables. Correlation referstothe degree of linear relationshipbetween twovariables. The typesof correlation are ï· Positive correlation
- 2. Teacherguidesstudents on howto plotscatter diagramsusinggraphic calculatoror the computer. Teacherguidesstudents on howto findthe centroid andhow to draw the line of bestfit. inorder to obtainthe centroid. Studentsuse their graphiccalculatorsor computerstoplot scatter plots,line of regressionand how to findthe equationof the line of regression. ï· Negative correlation A straightline which bestdescribesthe relationshipbetween the two variablesisthe line of regression(line of bestfit) The line of bestfitmustpass through centroid (( ðĨ â, )ðĶ â . The regressionequation of yon x isof the form ðĶ = ððĨ+ ð where mand c are constants Group work Teacherputs students ingroups andprovides each groupwitha bivariable dataforthem to generate the line of bestfit,find the equationforthe line of bestfitand use the equationtopredictone variable whenthe other variable isgiven Each group should presenttheirresponse on the worksheetfor presentationtothe class. Conclusion Teacherhighlightson mainideasand gives assignments. Studentscopy assignments
- 3. References Elective Mathematicsteaching syllabus.CRDD Hesse C.A., Elective MathematicsforSeniorHigh Schools.


