ºÝºÝߣ

ºÝºÝߣShare a Scribd company logo
www.TheOnlineGK.wordpress.com


India¡¯s effective literacy rate has recorded a 9.2 per cent rise to reach 74.04 per cent, according to provisional
data of the 2011 census released today. Interestingly, literacy rate improved sharply among females as
compared to males. While the effective literacy rate for males rose from 75.26 to 82.14 per cent marking a rise
of 6.9 per cent, it increased by 11.8 per cent for females to go from 53.67 to 65.46 per cent. According to
provisional totals of the latest census, literates constitute 74 per cent of total population aged seven and above.


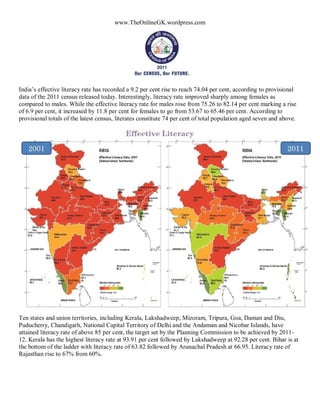
Ten states and union territories, including Kerala, Lakshadweep, Mizoram, Tripura, Goa, Daman and Diu,
Puducherry, Chandigarh, National Capital Territory of Delhi and the Andaman and Nicobar Islands, have
attained literacy rate of above 85 per cent, the target set by the Planning Commission to be achieved by 2011-
12. Kerala has the highest literacy rate at 93.91 per cent followed by Lakshadweep at 92.28 per cent. Bihar is at
the bottom of the ladder with literacy rate of 63.82 followed by Arunachal Pradesh at 66.95. Literacy rate of
Rajasthan rise to 67% from 60%.
Literacy Rate In Indian State: Census 2011


Rank State       Literacy   Literacy   Decadal    Literacy   Literacy   Decadal      Literacy    Literacy   Decadal
                 rate       rate       Change     Rate-      rate-      Change in    Rate-female rate-      Change in
                 (2001      (2011      in         Male       Male       Male         (2001       Female     Female
                 Census)    Census)    Literacy   (2001      (2011      Literacy     Census)     (2011      Literacy
                                       rate       Census)    Census)    Rate(2001-               Census)    Rate(2001-
                                       (2001-                           2011)                               2011)
                                       2011)
1    Andaman & 81.3%        86.3%      5.0%       86.3%      90.1%      3.8%         75.2%       81.8%      6.6%
     Nicobar
     Islands
2    Andhra        60.5%    67.7%      7.2%       70.3%      75.6%      5.3%         50.4%       59.7%      9.3%
     Pradesh
3    Arunachal     54.3%    67.0%      12.7%      63.8%      73.7%      9.9%         43.5%       59.6%      16.1%
     Pradesh
4    Assam         63.3%    73.2%      9.9%       71.3%      78.8%      7.5%         54.6%       67.3%      13.3%
5    Bihar         47.0%    63.8%      16.8%      59.7%      73.5%      13.8%        33.1%       53.3%      20.2%
6    Chandigarh 81.9.%      86.4%      4.5%       86.1%      90.5%      4.4%         76.5%       81.4%      4.9%
7    Chattisgarh 64.7%      71.0%      6.3%       77.4%      81.5%      4.1%         51.9%       60.6%      8.7%
8    Dadra &       57.6%    77.7%      20.1%      71.2%      86.5%      15.3%        40.2%       65.9%      25.7%
     Nagar Haveli
9    Daman & Diu 78.2%      87.1%      5.4%       86.8%      91.5%      4.7%         65.6%       79.6%      14.0%
10   Delhi         81.7%    86.3%      4.6%       87.3%      91.0%      3.7%         74.7%       80.9%      6.2%
11   Goa           82.0%    87.4%      5.4%       88.4%      92.8%      4.4%         75.4%       81.8%      6.4%
12   Gujarat       69.1%    79.3%      10.2%      79.7%      87.2%      7.5%         57.8%       70.7%      12.9%
13   Haryana       67.9%    76.6%      8.7%       78.5%      85.4%      6.9%         55.7%       66.8%      11.1%
14   Himachal      76.5%    83.8%      7.3%       85.3%      90.8%      5.5%         67.4%       76.6%      9.2%%
     Pradesh
15   Jammu and 55.5%        68.7%      13.2%      66.6%      78.3%      11.7%        43.0%       58.0%      15.0%
     Kashmir
16   Jharkhand     53.6%    67.6%      14.0%      67.3%      78.5%      11.2%        38.9%       56.2%      17.3%
17   Karnataka     66.6%    75.6%      9.0%       76.1%      82.8%      6.7%         56.9%       68.1%      11.2%
18   Kerala        90.9%    93.9%      3.0%       94.2%      96.0%      1.8%         87.7%       92.0%      4.3%
19   Lakshadweep 86.7%      92.3%      5.6%       92.5%      96.1%      3.6%         80.5%       88.2%      7.7%
20   Madhya        63.7%    70.6%      6.9%       76.1%      80.5%      4.4%         50.3%       60.0%      9.7%
     Pradesh
21   Maharashtra 76.9%      82.9%      6.0%       86.0%      89.8%      3.8%         67.0%       75.5%      8.5%
22   Manipur       69.9%    79.8%      9.9%       79.5%      86.5%      7.0%         60.1%       73.2%      13.1%
23   Meghalaya 62.6%        75.5%      12.9%      65.4%      77.2%      11.8%        59.6%       73.8%      14.2%
24   Mizoram       88.8%    91.6%      2.8%       90.7%      93.7%      3.0%         86.7%       89.4%      2.7%
25   Nagaland      66.6%    80.1%      13.5%      71.2%      83.3%      12.1%        61.5%       76.7%      15.2%
26   Orissa        63.1%    73.5%      10.4%      75.3%      82.4%      7.1%         50.5%       64.4%      13.9%
27   Puducherry 81.2%       86.5%      5.3%       88.6%      92.1%      3.5%         73.9%       81.2%      7.3%
28   Punjab        69.7%    76.7%      7.0%       75.2%      81.5%      6.3%         63.4%       71.3%      7.9%
29   Rajasthan     60.4%    67.1%      6.7%       75.7%      80.5%      4.8%         43.9%       52.7%      8.8%
30   Sikkim        68.8%    82.2%      13.4%      76.0%      87.3%      11.3%        60.4%       76.4%      16.0%
31   Tamil Nadu 73.5%       80.3%      6.8%       82.4%      86.8%      4.4%         64.4%       73.9%      9.5%
32   Tripura       73.2%    87.8%      14.6%      81.0%      92.2%      11.2%        64.9%       83.1%      18.2%
33   Uttar Pradesh 56.3%    69.7%      13.4%      68.8.%     79.2%      10.4%        42.2%       59.3%      17.1%
34   Uttarakhand 71.6%      79.6%      8.0%       83.3%      88.3%      5.0%         59.6%       70.7%      11.1%
35   West Bengal 68.6%      77.1%      8.5%       77.0%      82.7%      5.7%         59.6.%      71.2%      11.6%
-    Whole INDIA 64.83%     74.04%     9.21%      75.26%     82.14%     6.88%        53.67%      65.46%     11.79%

More Related Content

Literacy rate 2011 the onlinegk

  • 1. www.TheOnlineGK.wordpress.com India¡¯s effective literacy rate has recorded a 9.2 per cent rise to reach 74.04 per cent, according to provisional data of the 2011 census released today. Interestingly, literacy rate improved sharply among females as compared to males. While the effective literacy rate for males rose from 75.26 to 82.14 per cent marking a rise of 6.9 per cent, it increased by 11.8 per cent for females to go from 53.67 to 65.46 per cent. According to provisional totals of the latest census, literates constitute 74 per cent of total population aged seven and above. Ten states and union territories, including Kerala, Lakshadweep, Mizoram, Tripura, Goa, Daman and Diu, Puducherry, Chandigarh, National Capital Territory of Delhi and the Andaman and Nicobar Islands, have attained literacy rate of above 85 per cent, the target set by the Planning Commission to be achieved by 2011- 12. Kerala has the highest literacy rate at 93.91 per cent followed by Lakshadweep at 92.28 per cent. Bihar is at the bottom of the ladder with literacy rate of 63.82 followed by Arunachal Pradesh at 66.95. Literacy rate of Rajasthan rise to 67% from 60%.
  • 2. Literacy Rate In Indian State: Census 2011 Rank State Literacy Literacy Decadal Literacy Literacy Decadal Literacy Literacy Decadal rate rate Change Rate- rate- Change in Rate-female rate- Change in (2001 (2011 in Male Male Male (2001 Female Female Census) Census) Literacy (2001 (2011 Literacy Census) (2011 Literacy rate Census) Census) Rate(2001- Census) Rate(2001- (2001- 2011) 2011) 2011) 1 Andaman & 81.3% 86.3% 5.0% 86.3% 90.1% 3.8% 75.2% 81.8% 6.6% Nicobar Islands 2 Andhra 60.5% 67.7% 7.2% 70.3% 75.6% 5.3% 50.4% 59.7% 9.3% Pradesh 3 Arunachal 54.3% 67.0% 12.7% 63.8% 73.7% 9.9% 43.5% 59.6% 16.1% Pradesh 4 Assam 63.3% 73.2% 9.9% 71.3% 78.8% 7.5% 54.6% 67.3% 13.3% 5 Bihar 47.0% 63.8% 16.8% 59.7% 73.5% 13.8% 33.1% 53.3% 20.2% 6 Chandigarh 81.9.% 86.4% 4.5% 86.1% 90.5% 4.4% 76.5% 81.4% 4.9% 7 Chattisgarh 64.7% 71.0% 6.3% 77.4% 81.5% 4.1% 51.9% 60.6% 8.7% 8 Dadra & 57.6% 77.7% 20.1% 71.2% 86.5% 15.3% 40.2% 65.9% 25.7% Nagar Haveli 9 Daman & Diu 78.2% 87.1% 5.4% 86.8% 91.5% 4.7% 65.6% 79.6% 14.0% 10 Delhi 81.7% 86.3% 4.6% 87.3% 91.0% 3.7% 74.7% 80.9% 6.2% 11 Goa 82.0% 87.4% 5.4% 88.4% 92.8% 4.4% 75.4% 81.8% 6.4% 12 Gujarat 69.1% 79.3% 10.2% 79.7% 87.2% 7.5% 57.8% 70.7% 12.9% 13 Haryana 67.9% 76.6% 8.7% 78.5% 85.4% 6.9% 55.7% 66.8% 11.1% 14 Himachal 76.5% 83.8% 7.3% 85.3% 90.8% 5.5% 67.4% 76.6% 9.2%% Pradesh 15 Jammu and 55.5% 68.7% 13.2% 66.6% 78.3% 11.7% 43.0% 58.0% 15.0% Kashmir 16 Jharkhand 53.6% 67.6% 14.0% 67.3% 78.5% 11.2% 38.9% 56.2% 17.3% 17 Karnataka 66.6% 75.6% 9.0% 76.1% 82.8% 6.7% 56.9% 68.1% 11.2% 18 Kerala 90.9% 93.9% 3.0% 94.2% 96.0% 1.8% 87.7% 92.0% 4.3% 19 Lakshadweep 86.7% 92.3% 5.6% 92.5% 96.1% 3.6% 80.5% 88.2% 7.7% 20 Madhya 63.7% 70.6% 6.9% 76.1% 80.5% 4.4% 50.3% 60.0% 9.7% Pradesh 21 Maharashtra 76.9% 82.9% 6.0% 86.0% 89.8% 3.8% 67.0% 75.5% 8.5% 22 Manipur 69.9% 79.8% 9.9% 79.5% 86.5% 7.0% 60.1% 73.2% 13.1% 23 Meghalaya 62.6% 75.5% 12.9% 65.4% 77.2% 11.8% 59.6% 73.8% 14.2% 24 Mizoram 88.8% 91.6% 2.8% 90.7% 93.7% 3.0% 86.7% 89.4% 2.7% 25 Nagaland 66.6% 80.1% 13.5% 71.2% 83.3% 12.1% 61.5% 76.7% 15.2% 26 Orissa 63.1% 73.5% 10.4% 75.3% 82.4% 7.1% 50.5% 64.4% 13.9% 27 Puducherry 81.2% 86.5% 5.3% 88.6% 92.1% 3.5% 73.9% 81.2% 7.3% 28 Punjab 69.7% 76.7% 7.0% 75.2% 81.5% 6.3% 63.4% 71.3% 7.9% 29 Rajasthan 60.4% 67.1% 6.7% 75.7% 80.5% 4.8% 43.9% 52.7% 8.8% 30 Sikkim 68.8% 82.2% 13.4% 76.0% 87.3% 11.3% 60.4% 76.4% 16.0% 31 Tamil Nadu 73.5% 80.3% 6.8% 82.4% 86.8% 4.4% 64.4% 73.9% 9.5% 32 Tripura 73.2% 87.8% 14.6% 81.0% 92.2% 11.2% 64.9% 83.1% 18.2% 33 Uttar Pradesh 56.3% 69.7% 13.4% 68.8.% 79.2% 10.4% 42.2% 59.3% 17.1% 34 Uttarakhand 71.6% 79.6% 8.0% 83.3% 88.3% 5.0% 59.6% 70.7% 11.1% 35 West Bengal 68.6% 77.1% 8.5% 77.0% 82.7% 5.7% 59.6.% 71.2% 11.6% - Whole INDIA 64.83% 74.04% 9.21% 75.26% 82.14% 6.88% 53.67% 65.46% 11.79%