Live cache monitoring
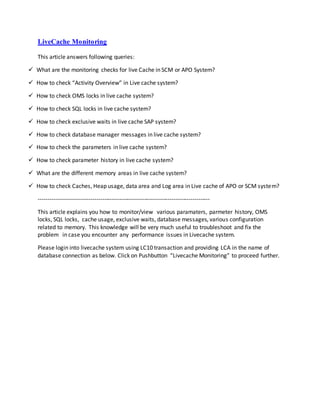
- 1. LiveCache Monitoring This article answers following queries: ? What are the monitoring checks for live Cache in SCM or APO System? ? How to check ˇ°Activity Overviewˇ± in Live cache system? ? How to check OMS locks in live cache system? ? How to check SQL locks in live cache system? ? How to check exclusive waits in live cache SAP system? ? How to check database manager messages in live cache system? ? How to check the parameters in live cache system? ? How to check parameter history in live cache system? ? What are the different memory areas in live cache system? ? How to check Caches, Heap usage, data area and Log area in Live cache of APO or SCM system? ----------------------------------------------------------------------------------------- This article explains you how to monitor/view various paramaters, parmeter history, OMS locks, SQL locks, cache usage, exclusive waits, database messages, various configuration related to memory. This knowledge will be very much useful to troubleshoot and fix the problem in case you encounter any performance issues in Livecache system. Please login into livecache system using LC10 transaction and providing LCA in the name of database connection as below. Click on Pushbutton ˇ°Livecache Monitoringˇ± to proceed further.
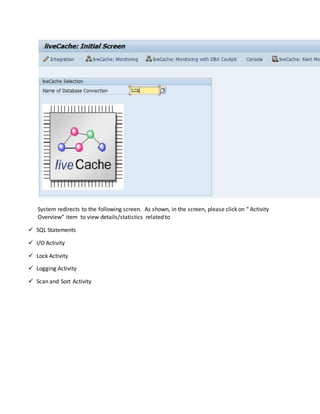
- 2. System redirects to the following screen. As shown, in the screen, please click on ˇ° Activity Overviewˇ± item to view details/statistics related to ? SQL Statements ? I/O Activity ? Lock Activity ? Logging Activity ? Scan and Sort Activity
- 3. To view OMS locks (or logical object locks) , navigate to LCA-> Problem Analysis -> OMS locks - > Overview as shown in the below screen.
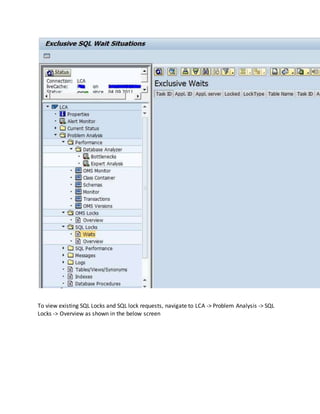
- 4. To view exclusive waits, navigate to LCA -> Problem Analysis -> SQL Locks -> Waits as shown in the below screen
- 5. To view existing SQL Locks and SQL lock requests, navigate to LCA -> Problem Analysis -> SQL Locks -> Overview as shown in the below screen
- 6. To check database manager messages, navigate to LCA -> Problem Analysis -> Messages -> Database Manager as shown in the below screen.
- 7. To view the defined parameters and their values in the live cache system, navigate to LCA -> Administration -> Configuration -> Parameters as shown in the below screen
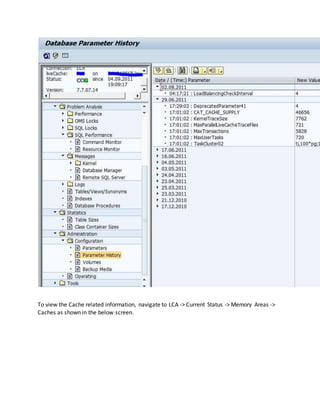
- 8. To view the history of the parameters that are changed date wise, navigate to to LCA -> Administration -> Configuration ->Parameter History as shown in the below screen
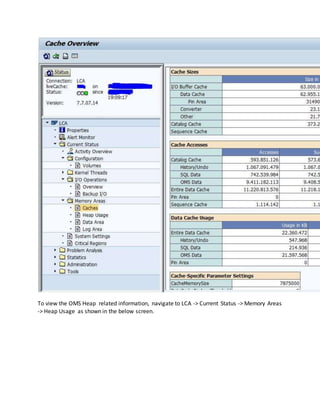
- 9. To view the Cache related information, navigate to LCA -> Current Status -> Memory Areas -> Caches as shown in the below screen.
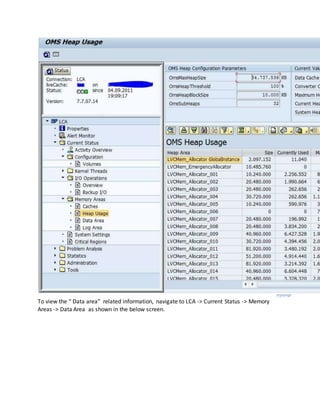
- 10. To view the OMS Heap related information, navigate to LCA -> Current Status -> Memory Areas -> Heap Usage as shown in the below screen.
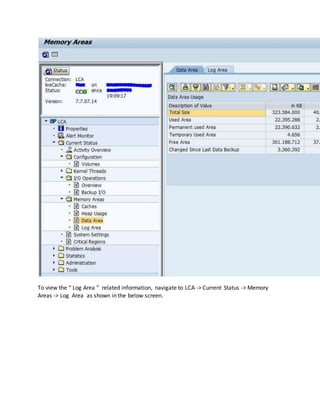
- 11. To view the ˇ° Data areaˇ± related information, navigate to LCA -> Current Status -> Memory Areas -> Data Area as shown in the below screen.
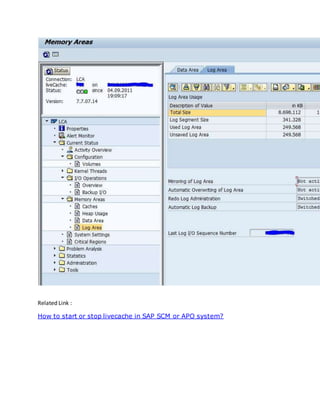
- 12. To view the ˇ° Log Area ˇ± related information, navigate to LCA -> Current Status -> Memory Areas -> Log Area as shown in the below screen.
- 13. Related Link : How to start or stop livecache in SAP SCM or APO system?

