Lowering Your Tco The Superiority Of The Cisco Solution
- 1. Competing on TCO: Superiority of the Cisco Solution Cisco Knowledge Network Sanjeev Mervana, Sr. Director, Product & Solutions Marketing, Cisco Systems Ray Mota, Managing Partner, ACG Research 7-24-12 ┬® 2011 Cisco and/or its affiliates. All rights reserved. Created by the BTA Team (ps_bta@cisco.com) Cisco Confidential 1
- 2. Sr. Director ŌĆō Managing Partner, Product and Solutions Marketing, ACG Research Cisco Systems, Inc. ┬® 2011 Cisco and/or its affiliates. All rights reserved. Created by the BTA Team (ps_bta@cisco.com) Cisco Confidential 2
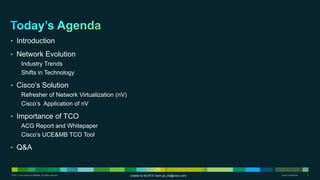
- 3. ŌĆó Introduction ŌĆó Network Evolution Industry Trends Shifts in Technology ŌĆó CiscoŌĆÖs Solution Refresher of Network Virtualization (nV) CiscoŌĆÖs Application of nV ŌĆó Importance of TCO ACG Report and Whitepaper CiscoŌĆÖs UCE&MB TCO Tool ŌĆó Q&A ┬® 2011 Cisco and/or its affiliates. All rights reserved. Created by the BTA Team (ps_bta@cisco.com) Cisco Confidential 3
- 4. 110 EB per mo 94 EB per mo 77 EB per mo 59 EB per mo 44 EB per mo 31 EB per mo 2011 2012 2013 2014 2015 2016 Source: Cisco VNI Global Forecast, 2011ŌĆō2016 ┬® 2011 Cisco and/or its affiliates. All rights reserved. Created by the BTA Team (ps_bta@cisco.com) Cisco Confidential 4
- 5. Application Virtualization Management Network Virtualization Core Edge Agg Access Optical ┬® 2011 Cisco and/or its affiliates. All rights reserved. Created by the BTA Team (ps_bta@cisco.com) Cisco Confidential 5
- 6. Now topology agnostic and all the way to access and mobile networks ASR 9000 System nV ASR 9922/ 9010 Simplify Operations 9006 / 9001 Reduce overall TCO nV Integrated A to Z Management nV ASR 903 ASR 903 ASR 9000v Multi-dimensional Scale ASR 903 System and services scale nV ASR 901 Increased Service Velocity Quickly deploy new services Simplifies the Network Improves Network Economics ┬® 2011 Cisco and/or its affiliates. All rights reserved. Created by the BTA Team (ps_bta@cisco.com) Cisco Confidential 6
- 7. ASR 9000 System is compared to a competing routing solution Core Network Core Network 100 GE Up Links 100 GE Up Links nV ASR 9922/9010/9006 ALU 7750 10 GE Up Links 10 GE Up Links ALU 7450 ESS-6/ nV nV nV nV ALU 7705 SAR 8 GE Access GE Access Ports Ports nV: Network Competing Routing Solution Virtualization ASR 9000v ┬® 2011 Cisco and/or its affiliates. All rights reserved. Created by the BTA Team (ps_bta@cisco.com) Cisco Confidential 7
- 8. Cost comparisons are made by modeling a aggregation/access network build-out over a 5 year period Modeling Process Assumptions Traffic Projection & Network Configuration TCO Comparisons Engineering ŌĆó ASR 9000 System ŌĆó Network Demographics ŌĆó CapEx Calculations o ASR 9922/9010/9006 ŌĆó Network Topology ŌĆó Traffic Forecast ŌĆó OpEx Calculations o ASR 9000v ŌĆó Network Equipment Type & ŌĆó Traffic Engineering ŌĆó TCO Comparisons ŌĆó Competing Router Models ŌĆó Port Requirements ŌĆó Financial Metrics o Aggregation ŌĆó Equipment Prices o Access ŌĆó OpEx Parameters ŌĆó Modeling process is ŌĆ£bottom-upŌĆØ similar to design and build-out of actual network ŌĆó Network demographics are for a typical aggregation networkŌĆö1000s of households ŌĆó Traffic projection models triple and quad play usage ŌĆó Each network element is configured down to the line card using vendorsŌĆÖ data sheets ŌĆó Equipment prices are at market ratesŌĆöheavily discounted ┬® 2011 Cisco and/or its affiliates. All rights reserved. Created by the BTA Team (ps_bta@cisco.com) Cisco Confidential 8
- 9. Traffic projections are used to dimension network requirements Year 1 Year 2 Year 3 Year 4 Year 5 Year 6 Residential Subscribers 250,000 300,000 350,000 400,000 450,000 500,000 DSLAMs 350 400 450 500 550 600 GE Ports per DSLAM 8 9 10 10 10 11 GE Access Ports 2,800 3,600 4,500 5,000 5,500 6,600 ASR 9000v 114 132 153 164 175 200 10 GE Ports on Single ASR 9000 Cluster Node 114 132 153 164 175 200 Number of ASR 9000 Clusters 1 1 1 1 1 1 ┬® 2011 Cisco and/or its affiliates. All rights reserved. Created by the BTA Team (ps_bta@cisco.com) Cisco Confidential 9
- 10. A detailed OpEx model is usedŌĆöit is driven by the network configuration outputs from the modeling process OPEX Breakdown $20 $18 $16 Savings 71% $14 $12 Millions Savings $10 60% $8 $6 $4 $2 $- ASR 9000 System Vendor A Vendor B Power Cooling Floor Space Tech Support & Service Network Care ┬® 2011 Cisco and/or its affiliates. All rights reserved. Created by the BTA Team (ps_bta@cisco.com) Cisco Confidential 10
- 11. CapEx and OpEx estimates are used to create a cash flow analysis Cisco ASR 9000 System Cash Flow Revenue OPEX CAPEX Cumulative Net Cash Flow $35 $30 $25 $20 $15 Millions $10 $5 $0 -$5 -$10 Year 1 Year 2 Year 3 Year 4 Year 5 Year 6 ┬® 2011 Cisco and/or its affiliates. All rights reserved. Created by the BTA Team (ps_bta@cisco.com) Cisco Confidential 11
- 12. A Business Case for Scaling the Next Generation Internet with the Cisco ASR 9000 System ŌĆó Cisco ASR 9000 System achieves dramatically reduced TCO through its network virtualization (nV) technology ŌĆó CapEx is reduced due to high port densities and more card slots per Available for download: chassis http://blogs.cisco.com ŌĆó The ASR 9000 SystemŌĆÖs network virtualization design simplifies network & operations and reduces operations expense (OpEx). http://www.acgresearch.net ŌĆó TCO is reduced by up to 73% over And search for competitive solutions that lack nV technology. ŌĆ£ACG Business Case for Next- ŌĆó The payback on the investment in a Generation InternetŌĆØ complete ASR 9000 System is less than one year. ┬® 2011 Cisco and/or its affiliates. All rights reserved. Created by the BTA Team (ps_bta@cisco.com) Cisco Confidential 12
- 13. ŌĆó CiscoŌĆÖs UCE&MB architectural approach for mixed access solutions (Mobile, Fixed, T1, Ethernet) is up to 37% lower TCO than competition ŌĆó CiscoŌĆÖs solution has the lowest CAPEX due to high port density, scalability, and unified access for mobile, fixed, T1, and Ethernet ŌĆō up to 36% lower CAPEX than competitors ŌĆó CiscoŌĆÖs innovation provides significant OPEX reductions: ’ā╝ Cisco nV contributes to lower OPEX by up to 59% ’ā╝ CiscoŌĆÖs solution has the lowest power consumption - up to 38% lower than competition ŌĆó Tool available via your Cisco Representative ┬® 2011 Cisco and/or its affiliates. All rights reserved. Created by the BTA Team (ps_bta@cisco.com) Cisco Confidential 13
- 14. ŌĆó Scenario-specific view of financial and non-financial metrics: TCO, OpEx, CapEx, Cash Flows, NPV, Chassis Count, etc. ŌĆó Ability to export input/ output/ assumptions for particular scenarios ŌĆó Tool available via your Cisco Representative ┬® 2011 Cisco and/or its affiliates. All rights reserved. Created by the BTA Team (ps_bta@cisco.com) Cisco Confidential 14
- 15. ŌĆó WeŌĆÖll be happy to answer them. ŌĆó Please use the Q&A box to the right of the screen. ┬® 2011 Cisco and/or its affiliates. All rights reserved. Created by the BTA Team (ps_bta@cisco.com) Cisco Confidential 15
- 16. Thank you. ┬® 2011 Cisco and/or its affiliates. All rights reserved. Created by the BTA Team (ps_bta@cisco.com) Created by the BTA Team (ps_bta@cisco.com) Cisco Confidential 16


