際際滷

際際滷Share a Scribd company logo
2010/6/8


          Trade Fairs in Asia:

 Results of the 6th annual survey


                Prepared by Business Strategies Group Ltd.

                              4th June 2010


           Report background
 Prepared by BSG since 2004
 Published jointly with UFI
 Draws on BSGs exhibition database
  developing since 2001
 Covers 15 key markets in Asia
 Focuses on B2B exhibitions >2,000 sqm
 Excludes B2C events


4th June 2010                      v1.0                      2


                                                                       1
2010/6/8


Highlights of 2009 Trade Fair
   Industry in Asia Report
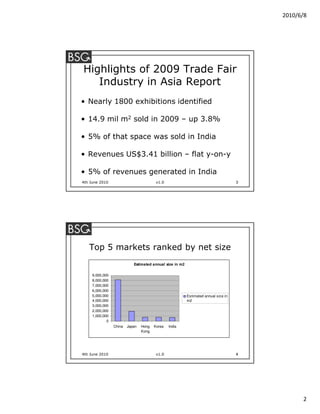
 Nearly 1800 exhibitions identified

 14.9 mil m2 sold in 2009  up 3.8%

 5% of that space was sold in India

 Revenues US$3.41 billion  flat y-on-y

 5% of revenues generated in India
4th June 2010                            v1.0                                        3


   Top 5 markets ranked by net size
                            Estimated annual size in m2

     9,000,000
     8,000,000
     7,000,000
     6,000,000
     5,000,000                                            Estimated annual size in
     4,000,000                                            m2
     3,000,000
     2,000,000
     1,000,000
             0
                 China   Japan   Hong   Korea   India
                                 Kong


4th June 2010                            v1.0                                        4


                                                                                               2
2010/6/8


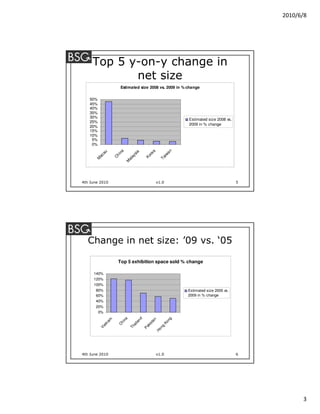
     Top 5 y-on-y change in
            net size
                       Estimated size 2008 vs. 2009 in % change

   50%
   45%
   40%
   35%
   30%
                                                                 Estimated size 2008 vs.
   25%
                                                                 2009 in % change
   20%
   15%
   10%
    5%
    0%


                                                           an
                        a


                                                 a
            au


                                  sia
                      in


                                              re


                                                         iw
         ac


                   Ch


                                            Ko
                               ay


                                                       Ta
      M


                             al
                            M


4th June 2010                                         v1.0                                 5


  Change in net size: 09 vs. 05

                     Top 5 exhibition space sold % change

     140%
     120%
     100%
      80%                                                        Estimated size 2005 vs.
      60%                                                        2009 in % change
      40%
      20%
       0%
                                       nd
                        na


                                                            ng
               m


                                                  n
                                               ta
             na


                        i


                                     la


                                                         Ko
                     Ch


                                              kis
                                  ai
           et


                                                        ng
                                Th


                                            Pa
         Vi


                                                     Ho


4th June 2010                                         v1.0                                 6


                                                                                                     3
2010/6/8


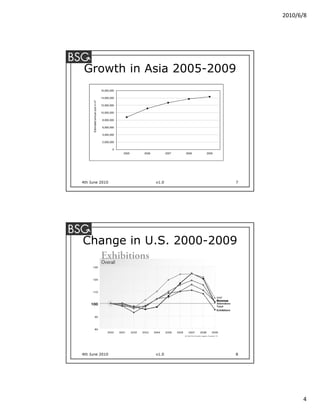
 Growth in Asia 2005-2009
                                   16,000,000

                                   14,000,000
     Estimated annual size in m2


                                   12,000,000

                                   10,000,000

                                    8,000,000

                                    6,000,000

                                    4,000,000

                                    2,000,000

                                           0
                                                2005   2006          2007   2008   2009


4th June 2010                                                 v1.0                        7


Change in U.S. 2000-2009


4th June 2010                                                 v1.0                        8


                                                                                                    4
2010/6/8


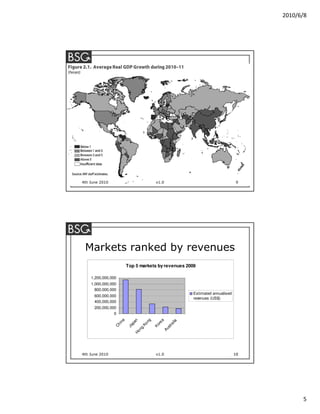
4th June 2010                              v1.0                                   9


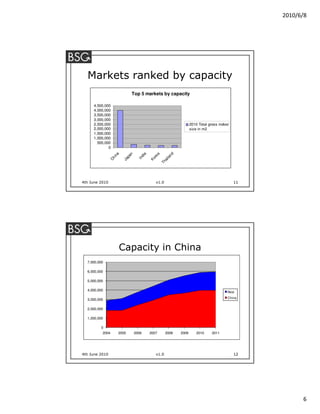
 Markets ranked by revenues
                         Top 5 markets by revenues 2009

    1,200,000,000
    1,000,000,000
      800,000,000
                                                          Estimated annualised
      600,000,000
                                                          revenues (US$)
      400,000,000
      200,000,000
                0
                    na


                                     ng
                            n


                                               a

                                                    lia
                          pa


                                            re
                   i


                                  Ko


                                                    ra
                Ch


                                          Ko
                         Ja


                                                 st
                                 ng


                                               Au
                              Ho


4th June 2010                              v1.0                                  10


                                                                                            5
2010/6/8


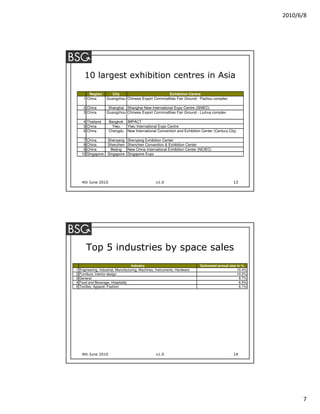
  Markets ranked by capacity
                              Top 5 markets by capacity

     4,500,000
     4,000,000
     3,500,000
     3,000,000
     2,500,000                                                         2010 Total gross indoor
     2,000,000                                                         size in m2
     1,500,000
     1,000,000
       500,000
             0


                                                           nd
                  na


                                       a
                             n


                                                a
                           pa


                                    di


                                             re
                   i


                                                         la
                                  In
                Ch


                                           Ko
                         Ja


                                                      ai
                                                    Th


4th June 2010                                 v1.0                                               11


                       Capacity in China
  7,000,000

  6,000,000

  5,000,000

  4,000,000                                                                                  Rest
                                                                                             China
  3,000,000

  2,000,000

  1,000,000

          0
          2004         2005      2006      2007        2008     2009       2010     2011


4th June 2010                                 v1.0                                               12


                                                                                                            6
2010/6/8


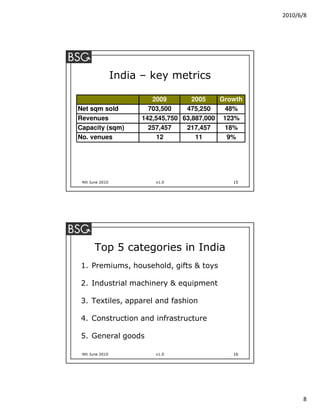
       10 largest exhibition centres in Asia

         Region          City                         Exhibition Centre
      1 China         Guangzhou Chinese Export Commodities Fair Ground - Pazhou complex

      2 China          Shanghai Shanghai New International Expo Centre (SNIEC)
      3 China         Guangzhou Chinese Export Commodities Fair Ground - Liuhua complex

      4 Thailand       Bangkok     IMPACT
      5 China           Yiwu       Yiwu International Expo Centre
      6 China          Chengdu     New International Convention and Exhibition Center (Century City)

      7   China       Shenyang     Shenyang Exhibition Center
      8   China       Shenzhen     Shenzhen Convention & Exhibition Center
      9   China         Beijing    New China International Exhibition Center (NCIEC)
     10   Singapore   Singapore    Singapore Expo


     4th June 2010                                   v1.0                                         13


          Top 5 industries by space sales
                                      Industry                                Estimated annual size in %
1   Engineering, Industrial, Manufacturing, Machines, Instruments, Hardware                         10.4%
2   Furniture, Interior design                                                                      10.2%
3   General                                                                                          8.7%
4   Food and Beverage, Hospitality                                                                   6.5%
5   Textiles, Apparel, Fashion                                                                       6.1%


     4th June 2010                                   v1.0                                         14


                                                                                                                  7
2010/6/8


                 India  key metrics

                          2009        2005    Growth
Net sqm sold             703,500    475,250    48%
Revenues               142,545,750 63,887,000 123%
Capacity (sqm)           257,457    217,457    18%
No. venues                  12         11       9%


 4th June 2010             v1.0                  15


       Top 5 categories in India
1. Premiums, household, gifts & toys

2. Industrial machinery & equipment

3. Textiles, apparel and fashion

4. Construction and infrastructure

5. General goods

 4th June 2010             v1.0                  16


                                                             8
2010/6/8


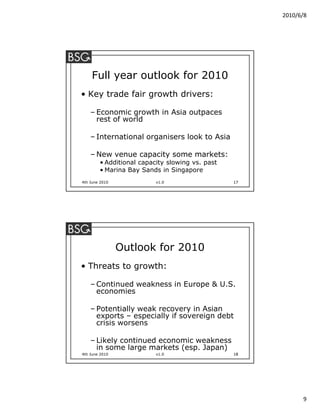
    Full year outlook for 2010
 Key trade fair growth drivers:

     Economic growth in Asia outpaces
      rest of world

     International organisers look to Asia

     New venue capacity some markets:
         Additional capacity slowing vs. past
         Marina Bay Sands in Singapore
4th June 2010             v1.0                   17


                Outlook for 2010
 Threats to growth:

     Continued weakness in Europe & U.S.
      economies

     Potentially weak recovery in Asian
      exports  especially if sovereign debt
      crisis worsens

     Likely continued economic weakness
      in some large markets (esp. Japan)
4th June 2010             v1.0                   18


                                                            9
2010/6/8


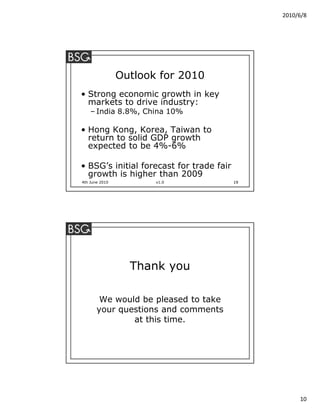
                Outlook for 2010
 Strong economic growth in key
  markets to drive industry:
     India 8.8%, China 10%

 Hong Kong, Korea, Taiwan to
  return to solid GDP growth
  expected to be 4%-6%

 BSGs initial forecast for trade fair
  growth is higher than 2009
4th June 2010          v1.0               19


                  Thank you

        We would be pleased to take
       your questions and comments
               at this time.


                                                    10
Ad

Recommended

Consolidation strategies
Serge Rivet
India Market Reflections (2008-12)
Saurabh Kumar
Business survey tendency 2010 III.Q_en
Association of Hungarian Plastics Industry
Electrolux Capital Markets Day 2012 - Presentation Alberto Zanata
Electrolux Group
China outbound Investment
Asian Horizon Ltd
4QO7 Results Conference Call Presentation
Tempo Participa巽探es
Tele2 First quarter 2012
Tele2
Auto Sector Monthly Update
Angel Broking
Testing times q2 2009
scrumpyjo
itSMFnz conference
itSMFnz conference
scrumpyjo
Paul Woodward
Paul Woodward
dmg events Middle East and Asia
BFA presentation
BFA presentation
benfranklinschool
Ng
Ng
Aiir
Nut
Nut
Aiir
Integrated Marketing - Overman
Eric Overman
Colliers International: Retail Highlights Fall 2010
Coy Davidson
Real Estate Market Report 1st qtr 2011
creba_nar
Leboncoin.fr - NOAH12 London
NOAH Advisors
Leboncoin.fr - NOAH12 London
Marco Rodzynek
MobileTechCon 2011 Mainz / Germany
Avenga Germany GmbH
Analysis of Revenue guidance - Infosys
Sarasvathi T.A
Evolutions of ad spend on Facebook Q2 2011
i-SCOOP
Tbg digital q2_2011_global_facebook_marketing_report
nich_marketing
Global Facebook Advertising Report Q2 2011 by TBG Digital
Kirill Smirnov
5th Annual Appraisal Summit
NVAR .com
Outdoor Broadcasting
Er MD FS
Creating Value in Banking 2011
Juan Lynch
Internet presentation q1_2010
SKF
Roy Webb - national economic conditions
lynchburg

More Related Content

Viewers also liked (7)

Testing times q2 2009
scrumpyjo
itSMFnz conference
itSMFnz conference
scrumpyjo
Paul Woodward
Paul Woodward
dmg events Middle East and Asia
BFA presentation
BFA presentation
benfranklinschool
Ng
Ng
Aiir
Nut
Nut
Aiir

Similar to Mark cochrane (20)

Integrated Marketing - Overman
Eric Overman
Colliers International: Retail Highlights Fall 2010
Coy Davidson
Real Estate Market Report 1st qtr 2011
creba_nar
Leboncoin.fr - NOAH12 London
NOAH Advisors
Leboncoin.fr - NOAH12 London
Marco Rodzynek
MobileTechCon 2011 Mainz / Germany
Avenga Germany GmbH
Analysis of Revenue guidance - Infosys
Sarasvathi T.A
Evolutions of ad spend on Facebook Q2 2011
i-SCOOP
Tbg digital q2_2011_global_facebook_marketing_report
nich_marketing
Global Facebook Advertising Report Q2 2011 by TBG Digital
Kirill Smirnov
5th Annual Appraisal Summit
NVAR .com
Outdoor Broadcasting
Er MD FS
Creating Value in Banking 2011
Juan Lynch
Internet presentation q1_2010
SKF
Roy Webb - national economic conditions
lynchburg
Latin america light vehicle outlook
ACARA
Ren Ren Company Ipo Analysis
kennyhongcfa
Nordea Forest Products & Paper Seminar in Helsinki. Presentation by CFO Marku...
Stora Enso
Tomas Bella
Tomas Bella
Oksana Kushnir
Retail US Highlights Spring 2011
Coy Davidson
Integrated Marketing - Overman
Eric Overman
Colliers International: Retail Highlights Fall 2010
Coy Davidson
Real Estate Market Report 1st qtr 2011
creba_nar
Leboncoin.fr - NOAH12 London
NOAH Advisors
Leboncoin.fr - NOAH12 London
Marco Rodzynek
MobileTechCon 2011 Mainz / Germany
Avenga Germany GmbH
Analysis of Revenue guidance - Infosys
Sarasvathi T.A
Evolutions of ad spend on Facebook Q2 2011
i-SCOOP
Tbg digital q2_2011_global_facebook_marketing_report
nich_marketing
Global Facebook Advertising Report Q2 2011 by TBG Digital
Kirill Smirnov
5th Annual Appraisal Summit
NVAR .com
Outdoor Broadcasting
Er MD FS
Creating Value in Banking 2011
Juan Lynch
Internet presentation q1_2010
SKF
Roy Webb - national economic conditions
lynchburg
Latin america light vehicle outlook
ACARA
Ren Ren Company Ipo Analysis
kennyhongcfa
Nordea Forest Products & Paper Seminar in Helsinki. Presentation by CFO Marku...
Stora Enso
Retail US Highlights Spring 2011
Coy Davidson
Ad

Recently uploaded (20)

Easy Solar Calculator for Homeowners : ksquare energy
Ksquare Energy Pvt. Ltd.
Glow Up Your Desk: The MOOJAY Monitor Stand Experience
Topmate
IT Companies in Magarpatta: A Thriving Hub of Technology and Innovation
prernarathi90
Tesia Dobrydnia - A Leader In Her Industry
Tesia Dobrydnia
Improving Sales Forecasting in Volatile B2B Capital Equipment Markets - Dave ...
Dave Litwiller
business and preparing for good business
jaslehannvillaflor
Recruitment Policy Sample, Recruitment Policy PDF
SeemaAgrawal43
placement-brochure Great lakes Gurgaon. 2025
charankumarboom
AX to Dynamics 365 Finance and Operations in USA.pdf
Trident information system
SACRS_Spring Mag 2025 Graceada Article.pdf
matthieu81
Filter Test machine .pdf
FILTRATION ENGINEERING & CUNSULTANT
The Science Behind Effective Lead Nurture Programs in B2B Marketing.pptx
brandonsoros91
Salary_Wage_Computation_3Day_Lesson.pptx
DaryllWhere
How Effective Leadership Drives Success and Accelerates Business Growth by De...
Devin Doyle
QuickBooks Keeps Freezing: Causes & Solutions.pptx
robastwilliams
Ihor Pavlenko: 丕仗舒于仍仆仆 亳亰亳从舒仄亳 亰舒 亟仂仗仂仄仂亞仂 AI (UA)
Lviv Startup Club
The APCO Geopolitical Radar Q3 2025 Edition
APCO
Agentic AI vs Generative AI Key Differences and Use Cases.pdf
SoluLab1231
Essar 2.0 Rising with a New Approach.pptx
essarupdate
Noah Loul Shares 5 Key Impacts of AI Agents on the Sales Industry
Noah Loul
Easy Solar Calculator for Homeowners : ksquare energy
Ksquare Energy Pvt. Ltd.
Glow Up Your Desk: The MOOJAY Monitor Stand Experience
Topmate
IT Companies in Magarpatta: A Thriving Hub of Technology and Innovation
prernarathi90
Tesia Dobrydnia - A Leader In Her Industry
Tesia Dobrydnia
Improving Sales Forecasting in Volatile B2B Capital Equipment Markets - Dave ...
Dave Litwiller
business and preparing for good business
jaslehannvillaflor
Recruitment Policy Sample, Recruitment Policy PDF
SeemaAgrawal43
placement-brochure Great lakes Gurgaon. 2025
charankumarboom
AX to Dynamics 365 Finance and Operations in USA.pdf
Trident information system
SACRS_Spring Mag 2025 Graceada Article.pdf
matthieu81
The Science Behind Effective Lead Nurture Programs in B2B Marketing.pptx
brandonsoros91
Salary_Wage_Computation_3Day_Lesson.pptx
DaryllWhere
How Effective Leadership Drives Success and Accelerates Business Growth by De...
Devin Doyle
QuickBooks Keeps Freezing: Causes & Solutions.pptx
robastwilliams
Ihor Pavlenko: 丕仗舒于仍仆仆 亳亰亳从舒仄亳 亰舒 亟仂仗仂仄仂亞仂 AI (UA)
Lviv Startup Club
The APCO Geopolitical Radar Q3 2025 Edition
APCO
Agentic AI vs Generative AI Key Differences and Use Cases.pdf
SoluLab1231
Essar 2.0 Rising with a New Approach.pptx
essarupdate
Noah Loul Shares 5 Key Impacts of AI Agents on the Sales Industry
Noah Loul
Ad

Mark cochrane

  • 1. 2010/6/8 Trade Fairs in Asia: Results of the 6th annual survey Prepared by Business Strategies Group Ltd. 4th June 2010 Report background Prepared by BSG since 2004 Published jointly with UFI Draws on BSGs exhibition database developing since 2001 Covers 15 key markets in Asia Focuses on B2B exhibitions >2,000 sqm Excludes B2C events 4th June 2010 v1.0 2 1
  • 2. 2010/6/8 Highlights of 2009 Trade Fair Industry in Asia Report Nearly 1800 exhibitions identified 14.9 mil m2 sold in 2009 up 3.8% 5% of that space was sold in India Revenues US$3.41 billion flat y-on-y 5% of revenues generated in India 4th June 2010 v1.0 3 Top 5 markets ranked by net size Estimated annual size in m2 9,000,000 8,000,000 7,000,000 6,000,000 5,000,000 Estimated annual size in 4,000,000 m2 3,000,000 2,000,000 1,000,000 0 China Japan Hong Korea India Kong 4th June 2010 v1.0 4 2
  • 3. 2010/6/8 Top 5 y-on-y change in net size Estimated size 2008 vs. 2009 in % change 50% 45% 40% 35% 30% Estimated size 2008 vs. 25% 2009 in % change 20% 15% 10% 5% 0% an a a au sia in re iw ac Ch Ko ay Ta M al M 4th June 2010 v1.0 5 Change in net size: 09 vs. 05 Top 5 exhibition space sold % change 140% 120% 100% 80% Estimated size 2005 vs. 60% 2009 in % change 40% 20% 0% nd na ng m n ta na i la Ko Ch kis ai et ng Th Pa Vi Ho 4th June 2010 v1.0 6 3
  • 4. 2010/6/8 Growth in Asia 2005-2009 16,000,000 14,000,000 Estimated annual size in m2 12,000,000 10,000,000 8,000,000 6,000,000 4,000,000 2,000,000 0 2005 2006 2007 2008 2009 4th June 2010 v1.0 7 Change in U.S. 2000-2009 4th June 2010 v1.0 8 4
  • 5. 2010/6/8 4th June 2010 v1.0 9 Markets ranked by revenues Top 5 markets by revenues 2009 1,200,000,000 1,000,000,000 800,000,000 Estimated annualised 600,000,000 revenues (US$) 400,000,000 200,000,000 0 na ng n a lia pa re i Ko ra Ch Ko Ja st ng Au Ho 4th June 2010 v1.0 10 5
  • 6. 2010/6/8 Markets ranked by capacity Top 5 markets by capacity 4,500,000 4,000,000 3,500,000 3,000,000 2,500,000 2010 Total gross indoor 2,000,000 size in m2 1,500,000 1,000,000 500,000 0 nd na a n a pa di re i la In Ch Ko Ja ai Th 4th June 2010 v1.0 11 Capacity in China 7,000,000 6,000,000 5,000,000 4,000,000 Rest China 3,000,000 2,000,000 1,000,000 0 2004 2005 2006 2007 2008 2009 2010 2011 4th June 2010 v1.0 12 6
  • 7. 2010/6/8 10 largest exhibition centres in Asia Region City Exhibition Centre 1 China Guangzhou Chinese Export Commodities Fair Ground - Pazhou complex 2 China Shanghai Shanghai New International Expo Centre (SNIEC) 3 China Guangzhou Chinese Export Commodities Fair Ground - Liuhua complex 4 Thailand Bangkok IMPACT 5 China Yiwu Yiwu International Expo Centre 6 China Chengdu New International Convention and Exhibition Center (Century City) 7 China Shenyang Shenyang Exhibition Center 8 China Shenzhen Shenzhen Convention & Exhibition Center 9 China Beijing New China International Exhibition Center (NCIEC) 10 Singapore Singapore Singapore Expo 4th June 2010 v1.0 13 Top 5 industries by space sales Industry Estimated annual size in % 1 Engineering, Industrial, Manufacturing, Machines, Instruments, Hardware 10.4% 2 Furniture, Interior design 10.2% 3 General 8.7% 4 Food and Beverage, Hospitality 6.5% 5 Textiles, Apparel, Fashion 6.1% 4th June 2010 v1.0 14 7
  • 8. 2010/6/8 India key metrics 2009 2005 Growth Net sqm sold 703,500 475,250 48% Revenues 142,545,750 63,887,000 123% Capacity (sqm) 257,457 217,457 18% No. venues 12 11 9% 4th June 2010 v1.0 15 Top 5 categories in India 1. Premiums, household, gifts & toys 2. Industrial machinery & equipment 3. Textiles, apparel and fashion 4. Construction and infrastructure 5. General goods 4th June 2010 v1.0 16 8
  • 9. 2010/6/8 Full year outlook for 2010 Key trade fair growth drivers: Economic growth in Asia outpaces rest of world International organisers look to Asia New venue capacity some markets: Additional capacity slowing vs. past Marina Bay Sands in Singapore 4th June 2010 v1.0 17 Outlook for 2010 Threats to growth: Continued weakness in Europe & U.S. economies Potentially weak recovery in Asian exports especially if sovereign debt crisis worsens Likely continued economic weakness in some large markets (esp. Japan) 4th June 2010 v1.0 18 9
  • 10. 2010/6/8 Outlook for 2010 Strong economic growth in key markets to drive industry: India 8.8%, China 10% Hong Kong, Korea, Taiwan to return to solid GDP growth expected to be 4%-6% BSGs initial forecast for trade fair growth is higher than 2009 4th June 2010 v1.0 19 Thank you We would be pleased to take your questions and comments at this time. 10