Market Basket Analysis 6.15.15
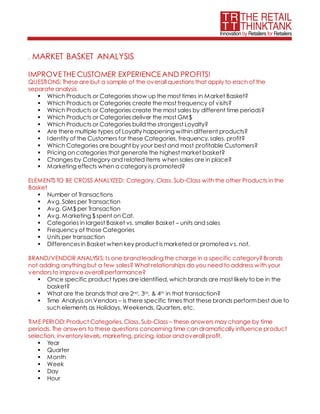
- 1. . MARKET BASKET ANALYSIS IMPROVETHE CUSTOMER EXPERIENCEAND PROFITS! QUESTIONS: These are but a sample of the overall questions that apply to each of the separate analysis ’é¦ Which Products or Categories show up the most times in Market Basket? ’é¦ Which Products or Categories create the most frequency of visits? ’é¦ Which Products or Categories create the most sales by different time periods? ’é¦ Which Products or Categories deliver the most GM$ ’é¦ Which Products or Categories build the strongest Loyalty? ’é¦ Are there multiple types of Loyalty happening within different products? ’é¦ Identity of the Customers for these Categories, frequency, sales, profit? ’é¦ Which Categories are bought by your best and most profitable Customers? ’é¦ Pricing on categories that generate the highest market basket? ’é¦ Changes by Category and related items when sales are in place? ’é¦ Marketing effects when a category is promoted? ELEMENTS TO BE CROSS ANALYZED: Category, Class, Sub-Class with the other Products in the Basket ’é¦ Number of Transactions ’é¦ Avg. Sales per Transaction ’é¦ Avg. GM$ per Transaction ’é¦ Avg. Marketing $ spent on Cat. ’é¦ Categories in largest Basket vs. smaller Basket ŌĆō units and sales ’é¦ Frequency of those Categories ’é¦ Units per transaction ’é¦ Differencesin Basket when key product is marketed or promoted vs. not. BRAND/VENDOR ANALYSIS: Is one brand leading the charge in a specific category?Brands not adding anything but a few sales? What relationships do you need to address with your vendorsto improve overall performance? ’é¦ Once specific product types are identified, which brands are most likely to be in the basket? ’é¦ What are the brands that are 2nd, 3rd, & 4th in that transaction? ’é¦ Time Analysis on Vendors ŌĆō is there specific times that these brands performbest due to such elements as Holidays, Weekends, Quarters, etc. TIME PERIOD: Product Categories, Class, Sub-Class ŌĆō these answers may change by time periods. The answers to these questions concerning time can dramatically influence product selection, inventory levels, marketing, pricing, labor and overall profit. ’é¦ Year ’é¦ Quarter ’é¦ Month ’é¦ Week ’é¦ Day ’é¦ Hour
- 2. PRICING ANALYSIS ’é¦ What is the average priceof a category, class or sub-class going out the door? ’é¦ Can changes in pricing lead to frequency, more sales, higher GM$? MARKETING: Which channels of marketing affect specific products and increaseoverall performance of specific Products. ’é¦ Analysis of categories when specific marketing channelsare used. Radio, Billboards, E- mail as examples. CUSTOMER DEMOGRAPHICS IN THE DIFFERENTMARKETBASKET ANALYSIS ’é¦ Location in USA ’é¦ Location in State ’é¦ Location in City ’é¦ Age ’é¦ Gender ’é¦ Financial ’é¦ Race ’é¦ Housing- Own vs. Rent CHANNEL DIFFERENCES AND COMBINATIONS ’é¦ How do Product associations by baskets differ by Channel? ’ā╝ Time of shopping ’ā╝ Similar products in basket ’ā╝ Pricing differences ’é¦ Can we learn what level of involvement came fromthe web to shop the store? ADDITIONAL QUESTIONS ONCE ANALYSIS IS COMPLETED ’é¦ What are the value propositions of the top products? o How can the answers be used for additional products ’é¦ Who are the competitors for those products? o What is the opportunity or risk? ’é¦ What Marketing elements to change, add, or reduce by products and time. ’é¦ Inventory adjustments by location, time ’é¦ Location in store and online for products ’é¦ Allocation of space in store and E-Commerce for Products and Categories SUGGESTED TESTS ’é¦ In a Brick-N-Mortar situation, take the top 50 doors and do a complete, full scale analysis on a product category. Understand the elements that drivethe highest volume doors. ’é¦ Test the Top 50 Learning on at set of Middle 50 doors. See if those learnings can be applied to be useful in another scenario. ’é¦ Use different types of marketing in similar locations to see how the Market Basket is affected. ’é¦ Test new and old marketing channels using specific products that may lead to better performance.

