Marketing Research Project

1) The document discusses characteristics of good community leaders based on a study of 102 respondents. It identifies 4 key factors that describe good leadership: positive characteristics (vision, communication skills, character, personality), spontaneous decision characteristics (spending time with subordinates, fearless attitude), negative characteristics (not being punctual, honest, lacking monitoring skills), and spiritual characteristics (thinking about enlisting help rather than problems, not being aggressive). 2) Factor analysis was used to identify these 4 factors, which together account for about 61% of the variability in responses. Variables were grouped under each factor based on their loadings in the rotated component matrix. 3) The 4 factors provide an overview of the characteristics respondents associated with good

Marketing Research Project
- 1. To Study the Perception RegardingTo Study the Perception Regarding Good Leader in the CommunityGood Leader in the Community Presented by, LeaderŌĆÖs group
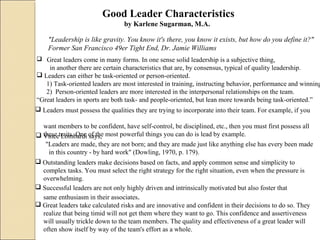
- 2. Good Leader Characteristics by Karlene Sugarman, M.A. "Leadership is like gravity. You know it's there, you know it exists, but how do you define it?" Former San Francisco 49er Tight End, Dr. Jamie Williams ’ü▒ Great leaders come in many forms. In one sense solid leadership is a subjective thing, in another there are certain characteristics that are, by consensus, typical of quality leadership. ’ü▒ Leaders can either be task-oriented or person-oriented. 1) Task-oriented leaders are most interested in training, instructing behavior, performance and winning 2) Person-oriented leaders are more interested in the interpersonal relationships on the team. ŌĆ£Great leaders in sports are both task- and people-oriented, but lean more towards being task-oriented.ŌĆØ ’ü▒ Leaders must possess the qualities they are trying to incorporate into their team. For example, if you want members to be confident, have self-control, be disciplined, etc., then you must first possess all these traits. One of the most powerful things you can do is lead by example.’ü▒ Vince Lombardi says, "Leaders are made, they are not born; and they are made just like anything else has every been made in this country - by hard work" (Dowling, 1970, p. 179). ’ü▒ Outstanding leaders make decisions based on facts, and apply common sense and simplicity to complex tasks. You must select the right strategy for the right situation, even when the pressure is overwhelming. ’ü▒ Successful leaders are not only highly driven and intrinsically motivated but also foster that same enthusiasm in their associates. ’ü▒ Great leaders take calculated risks and are innovative and confident in their decisions to do so. They realize that being timid will not get them where they want to go. This confidence and assertiveness will usually trickle down to the team members. The quality and effectiveness of a great leader will often show itself by way of the team's effort as a whole.
- 3. Introduction:Introduction: ’āśFactor analysis is a method of data reduction.╠² It does this by seeking underlying unobservable variables that are reflected in the observed variables.╠² ’āś There are many different methods that can be used to conduct a factor analysis such as principal axis factor, maximum likelihood, generalized least squares, unweighted least squares. ’āśGiven the number of factor analytic techniques and options, it is not surprising that different analysts could reach very different results analyzing the same data set.╠² However, all analysts are looking for simple structure.╠² ’āśSimple structure is pattern of results such that each variable loads highly onto one and only one factor.╠² ’āśFactor analysis is a technique that requires a large sample size.╠² ’āś Factor analysis is based on the correlation matrix of the variables involved, and correlations usually need a large sample size before they stabilize.
- 4. Assumption of Factor AnalysisAssumption of Factor Analysis ’āśFactor analysis is designed for interval data, although it can also be used for ordinal data (e.g. scores assigned to Likert scales). ’āśThe variables used in factor analysis should be linearly related to each other. ’āśThis can be checked by looking at scatterplots of pairs of variables. ’āśObviously the variables must also be at least moderately correlated to each other, otherwise the number of factors will be almost the same as the number of original variables, which means that carrying out a factor analysis would be pointless.
- 5. Research PurposeResearch Purpose ŌĆ£The Purpose of this study are to explore the Good leader Characteristics in community in terms of vision, ethics, reality and courage, time punctuality, Good character & personality, responsible nature etc. ŌĆ£ ŌĆ£To compare these Characteristics, to determine which of these Characteristics relate to Good leader effectiveness in community .ŌĆØ ŌĆ£To construct a hypothesized model of Good leader Characteristics in the perspective of community.ŌĆØ
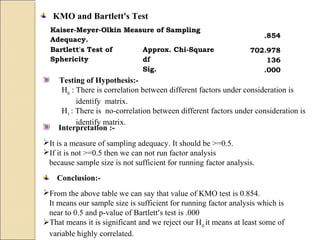
- 8. KMO and Bartlett's Test Kaiser-Meyer-Olkin Measure of Sampling Adequacy. .854 Bartlett's Test of Sphericity Approx. Chi-Square 702.978 df 136 Sig. .000 Interpretation :- ’āśIt is a measure of sampling adequacy. It should be >=0.5. ’āśIf it is not >=0.5 then we can not run factor analysis because sample size is not sufficient for running factor analysis. Conclusion:- ’āśFrom the above table we can say that value of KMO test is 0.854. It means our sample size is sufficient for running factor analysis which is near to 0.5 and p-value of BartlettŌĆÖs test is .000 ’āśThat means it is significant and we reject our H0 it means at least some of variable highly correlated. Testing of Hypothesis:- H0 : There is correlation between different factors under consideration is identify matrix. H1 : There is no-correlation between different factors under consideration is identify matrix.
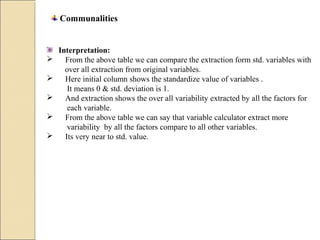
- 9. Communalities Interpretation: ’āś From the above table we can compare the extraction form std. variables with over all extraction from original variables. ’āś Here initial column shows the standardize value of variables . It means 0 & std. deviation is 1. ’āś And extraction shows the over all variability extracted by all the factors for each variable. ’āś From the above table we can say that variable calculator extract more variability by all the factors compare to all other variables. ’āś Its very near to std. value.
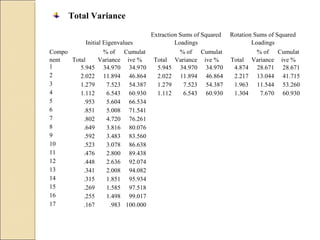
- 10. Total Variance Compo nent Initial Eigenvalues Extraction Sums of Squared Loadings Rotation Sums of Squared Loadings Total % of Variance Cumulat ive % Total % of Variance Cumulat ive % Total % of Variance Cumulat ive % 1 5.945 34.970 34.970 5.945 34.970 34.970 4.874 28.671 28.671 2 2.022 11.894 46.864 2.022 11.894 46.864 2.217 13.044 41.715 3 1.279 7.523 54.387 1.279 7.523 54.387 1.963 11.544 53.260 4 1.112 6.543 60.930 1.112 6.543 60.930 1.304 7.670 60.930 5 .953 5.604 66.534 6 .851 5.008 71.541 7 .802 4.720 76.261 8 .649 3.816 80.076 9 .592 3.483 83.560 10 .523 3.078 86.638 11 .476 2.800 89.438 12 .448 2.636 92.074 13 .341 2.008 94.082 14 .315 1.851 95.934 15 .269 1.585 97.518 16 .255 1.498 99.017 17 .167 .983 100.000
- 11. Interpretation:- Here above table total column shows us eigenvalue. Eigenvalue should be >1 because our standard variability is 1 and by comparing that value with eigenvalue first 4 factors extract more variability , And other factors extract less variability. so we can choose only 4 factors. % of variance column shows variability extracted in % by each factor. Cumulative % column shows cumulative % of extracted variability. Conclusion:- ’āś The leftmost section of this table shows the variance explained by the initial solution. ’āś Only four factors in the initial solution have eigenvalues greater than 1. ’āś Together, they account for almost 61% of the variability in the original variables. ’āś The second section of this table shows the variance explained by the extracted factors before rotation. ’āś The cumulative variability explained by these four factors in the extracted solution is about 61%. The rightmost section of this table shows the variance explained by the extracted factors after rotation. The rotated factor model makes some small adjustments to factors 1,2,3 but factor 4 is left virtually unchanged. Look for changes between the unrotated and rotated factor matrices to see how the rotation affects the interpretation of the first, second & third factors.
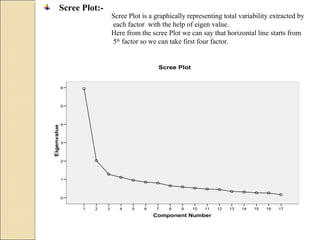
- 12. Scree Plot:- Component Number 1716151413121110987654321 Eigenvalue 6 5 4 3 2 1 0 Scree Plot Scree Plot is a graphically representing total variability extracted by each factor with the help of eigen value. Here from the scree Plot we can say that horizontal line starts from 5th factor so we can take first four factor.
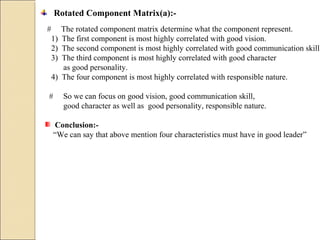
- 13. Rotated Component Matrix(a):- # The rotated component matrix determine what the component represent. 1) The first component is most highly correlated with good vision. 2) The second component is most highly correlated with good communication skill 3) The third component is most highly correlated with good character as good personality. 4) The four component is most highly correlated with responsible nature. # So we can focus on good vision, good communication skill, good character as well as good personality, responsible nature. Conclusion:- ŌĆ£We can say that above mention four characteristics must have in good leaderŌĆØ
- 14. Naming the Factors: (Surrogated Variables) 1) We obtain the factor loading in below table. 2) Once, we fill that the variables can be groups mathematically and logically under various factors, we group them. 3) Then we give the logical names to those groups of variables. 4) The group of variables and their factors which are named logically as displayed in table.
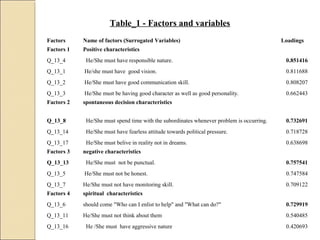
- 15. Factors Name of factors (Surrogated Variables) Loadings Factors 1 Positive characteristics Q_13_4 He/She must have responsible nature. 0.851416 Q_13_1 He/she must have good vision. 0.811688 Q_13_2 He/She must have good communication skill. 0.808207 Q_13_3 He/She must be having good character as well as good personality. 0.662443 Factors 2 spontaneous decision characteristics Q_13_8 He/She must spend time with the subordinates whenever problem is occurring. 0.732691 Q_13_14 He/She must have fearless attitude towards political pressure. 0.718728 Q_13_17 He/She must belive in reality not in dreams. 0.638698 Factors 3 negative characteristics Q_13_13 He/She must not be punctual. 0.757541 Q_13_5 He/She must not be honest. 0.747584 Q_13_7 He/She must not have monitoring skill. 0.709122 Factors 4 spiritual characteristics Q_13_6 should come "Who can I enlist to help" and "What can do?" 0.729919 Q_13_11 He/She must not think about them 0.540485 Q_13_16 He /She must have aggressive nature 0.420693 Table_1 - Factors and variables
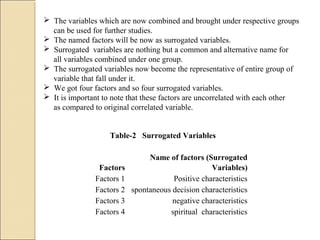
- 16. ’āś The variables which are now combined and brought under respective groups can be used for further studies. ’āś The named factors will be now as surrogated variables. ’āś Surrogated variables are nothing but a common and alternative name for all variables combined under one group. ’āś The surrogated variables now become the representative of entire group of variable that fall under it. ’āś We got four factors and so four surrogated variables. ’āś It is important to note that these factors are uncorrelated with each other as compared to original correlated variable. ╠² ╠² ╠² Factors Name of factors (Surrogated Variables) Factors 1 Positive characteristics Factors 2 spontaneous decision characteristics Factors 3 negative characteristics Factors 4 spiritual characteristics Table-2 Surrogated Variables
- 17. Final conclusion of analysis:- Initially we show that 17 variables under study were highly correlated and so we took the decision to group them through factor analysis. The results of factors analysis are quite fruitful and we have derived four factors and hence four surrogated variables. 1) In table The factors deals with ŌĆśPositive╠²characteristics╠². ╠²╠²╠²╠²╠²╠²╠²╠²╠²╠²╠²In╠²other╠²words╠²variable╠²that╠²can╠²share╠²common╠²information╠²related╠²to╠² ╠²╠²╠²╠²╠²╠²╠²╠²╠²╠²╠²number╠²of╠²respondent, ╠²╠²╠²╠²╠²╠²2)╠²second╠²factor╠²deals╠²with╠²number╠²of╠²╠²spontaneous╠²decision╠²characteristics.╠² ╠²╠²╠²╠²╠²╠²3)╠²third╠²factor╠²deals╠²with╠²some╠²of╠²the╠²negative╠²characteristics╠². ╠²╠²╠²╠²╠²╠²4)╠²four╠²factor╠²deals╠²with╠²some╠²of╠²the╠²spiritual╠²╠²characteristics.