際際滷

際際滷Share a Scribd company logo
3 - 1
Copyright McGraw-Hill/Irwin, 2002
Markets
Demand Defined
Demand Graphed
Changes in Demand
Supply Defined
Supply Graphed
Changes in Supply
Equilibrium
Surpluses
Shortages
Key Terms
Previous
際際滷
Next
際際滷
End
Show
Individual
Markets
Demand & Supply
3C H A P T E R
3 - 2
Copyright McGraw-Hill/Irwin, 2002
Markets
Demand Defined
Demand Graphed
Changes in Demand
Supply Defined
Supply Graphed
Changes in Supply
Equilibrium
Surpluses
Shortages
Key Terms
Previous
際際滷
Next
際際滷
End
Show
MARKETS DEFINED
MARKETS
POTENTIAL
SELLERS
POTENTIAL
BUYERS
3 - 3
Copyright McGraw-Hill/Irwin, 2002
Markets
Demand Defined
Demand Graphed
Changes in Demand
Supply Defined
Supply Graphed
Changes in Supply
Equilibrium
Surpluses
Shortages
Key Terms
Previous
際際滷
Next
際際滷
End
Show
$5
4
3
2
1
DEMAND DEFINED
DEMAND SCHEDULE
Various Amounts
A Series of Possible Prices
a specified time period
other things being equal
P QD
10
20
35
55
80
3 - 4
Copyright McGraw-Hill/Irwin, 2002
Markets
Demand Defined
Demand Graphed
Changes in Demand
Supply Defined
Supply Graphed
Changes in Supply
Equilibrium
Surpluses
Shortages
Key Terms
Previous
際際滷
Next
際際滷
End
Show
LAW OF DEMAND
 As Price Falls
Quantity Demanded Rises
 As Price Rises
Quantity Demanded Falls
An inverse relationship exists
between price and quantity
demanded
3 - 5
Copyright McGraw-Hill/Irwin, 2002
Markets
Demand Defined
Demand Graphed
Changes in Demand
Supply Defined
Supply Graphed
Changes in Supply
Equilibrium
Surpluses
Shortages
Key Terms
Previous
際際滷
Next
際際滷
End
Show
 Diminishing Marginal Utility
LAW OF DEMAND
3 - 6
Copyright McGraw-Hill/Irwin, 2002
Markets
Demand Defined
Demand Graphed
Changes in Demand
Supply Defined
Supply Graphed
Changes in Supply
Equilibrium
Surpluses
Shortages
Key Terms
Previous
際際滷
Next
際際滷
End
Show
 Diminishing Marginal Utility
LAW OF DEMAND
 Income Effect
3 - 7
Copyright McGraw-Hill/Irwin, 2002
Markets
Demand Defined
Demand Graphed
Changes in Demand
Supply Defined
Supply Graphed
Changes in Supply
Equilibrium
Surpluses
Shortages
Key Terms
Previous
際際滷
Next
際際滷
End
Show
 Diminishing Marginal Utility
LAW OF DEMAND
 Income Effect
 Substitution Effect
3 - 8
Copyright McGraw-Hill/Irwin, 2002
Markets
Demand Defined
Demand Graphed
Changes in Demand
Supply Defined
Supply Graphed
Changes in Supply
Equilibrium
Surpluses
Shortages
Key Terms
Previous
際際滷
Next
際際滷
End
Show
 Diminishing Marginal Utility
 Income Effect
 Substitution Effect
LAW OF DEMAND
 Demand Curve
 Individual and Market
Demand
3 - 9
Copyright McGraw-Hill/Irwin, 2002
Markets
Demand Defined
Demand Graphed
Changes in Demand
Supply Defined
Supply Graphed
Changes in Supply
Equilibrium
Surpluses
Shortages
Key Terms
Previous
際際滷
Next
際際滷
End
Show
DETERMINANTS OF
DEMAND
 Tastes and Preferences
 Number of Buyers
 Incomes
 Normal (Superior) & Inferior Goods
 Prices of Related Goods
 Substitutes & Complements
 Unrelated Goods
 Expectations
3 - 10
Copyright McGraw-Hill/Irwin, 2002
Markets
Demand Defined
Demand Graphed
Changes in Demand
Supply Defined
Supply Graphed
Changes in Supply
Equilibrium
Surpluses
Shortages
Key Terms
Previous
際際滷
Next
際際滷
End
Show
GRAPHING DEMAND
P
Qo
$5
4
3
2
1
P QD
$5
4
3
2
1
10
20
35
55
80
Price of Corn
Quantity of Corn
CORN
Plot the Points
10 20 30 40 50 60 70 80
3 - 11
Copyright McGraw-Hill/Irwin, 2002
Markets
Demand Defined
Demand Graphed
Changes in Demand
Supply Defined
Supply Graphed
Changes in Supply
Equilibrium
Surpluses
Shortages
Key Terms
Previous
際際滷
Next
際際滷
End
Show
55
P
Qo
$5
4
3
2
1
P QD
$5
4
3
2
1
10
20
35
55
80
Price of Corn
Quantity of Corn
CORN
Plot the Points
10 20 30 40 50 60 70 80
GRAPHING DEMAND
3 - 12
Copyright McGraw-Hill/Irwin, 2002
Markets
Demand Defined
Demand Graphed
Changes in Demand
Supply Defined
Supply Graphed
Changes in Supply
Equilibrium
Surpluses
Shortages
Key Terms
Previous
際際滷
Next
際際滷
End
Show
35
P
Qo
$5
4
3
2
1
P QD
$5
4
3
2
1
10
20
35
55
80
Price of Corn
Quantity of Corn
CORN
Plot the Points
10 20 30 40 50 60 70 80
GRAPHING DEMAND
3 - 13
Copyright McGraw-Hill/Irwin, 2002
Markets
Demand Defined
Demand Graphed
Changes in Demand
Supply Defined
Supply Graphed
Changes in Supply
Equilibrium
Surpluses
Shortages
Key Terms
Previous
際際滷
Next
際際滷
End
Show
P
Qo
$5
4
3
2
1
P QD
$5
4
3
2
1
10
20
35
55
80
Price of Corn
Quantity of Corn
CORN
Plot the Points
10 20 30 40 50 60 70 80
GRAPHING DEMAND
3 - 14
Copyright McGraw-Hill/Irwin, 2002
Markets
Demand Defined
Demand Graphed
Changes in Demand
Supply Defined
Supply Graphed
Changes in Supply
Equilibrium
Surpluses
Shortages
Key Terms
Previous
際際滷
Next
際際滷
End
Show
P
Qo
$5
4
3
2
1
P QD
$5
4
3
2
1
10
20
35
55
80
Price of Corn
Quantity of Corn
CORN
Plot the Points
10 20 30 40 50 60 70 80
GRAPHING DEMAND
3 - 15
Copyright McGraw-Hill/Irwin, 2002
Markets
Demand Defined
Demand Graphed
Changes in Demand
Supply Defined
Supply Graphed
Changes in Supply
Equilibrium
Surpluses
Shortages
Key Terms
Previous
際際滷
Next
際際滷
End
Show
P
Qo
$5
4
3
2
1
P QD
$5
4
3
2
1
10
20
35
55
80
D
Price of Corn
Quantity of Corn
CORN
Connect the Points
10 20 30 40 50 60 70 80
GRAPHING DEMAND
3 - 16
Copyright McGraw-Hill/Irwin, 2002
Markets
Demand Defined
Demand Graphed
Changes in Demand
Supply Defined
Supply Graphed
Changes in Supply
Equilibrium
Surpluses
Shortages
Key Terms
Previous
際際滷
Next
際際滷
End
Show
P
Qo
$5
4
3
2
1
P QD
$5
4
3
2
1
10
20
35
55
80
D
Price of Corn
Quantity of Corn
CORN
10 20 30 40 50 60 70 80
What if
Demand
Increases?
GRAPHING DEMAND
3 - 17
Copyright McGraw-Hill/Irwin, 2002
Markets
Demand Defined
Demand Graphed
Changes in Demand
Supply Defined
Supply Graphed
Changes in Supply
Equilibrium
Surpluses
Shortages
Key Terms
Previous
際際滷
Next
際際滷
End
Show
P
Qo
$5
4
3
2
1
P QD
$5
4
3
2
1
D
Price of Corn
Quantity of Corn
CORN
10 20 30 40 50 60 70 80
D
Increase
in
Demand
Increase
in Quantity
Demanded10
20
35
55
80
30
40
60
80
+
GRAPHING DEMAND
3 - 18
Copyright McGraw-Hill/Irwin, 2002
Markets
Demand Defined
Demand Graphed
Changes in Demand
Supply Defined
Supply Graphed
Changes in Supply
Equilibrium
Surpluses
Shortages
Key Terms
Previous
際際滷
Next
際際滷
End
Show
P
Qo
$5
4
3
2
1
P QD
$5
4
3
2
1
10
20
35
55
80
D
Price of Corn
Quantity of Corn
CORN
10 20 30 40 50 60 70 80
What if
Demand
Decreases?
GRAPHING DEMAND
3 - 19
Copyright McGraw-Hill/Irwin, 2002
Markets
Demand Defined
Demand Graphed
Changes in Demand
Supply Defined
Supply Graphed
Changes in Supply
Equilibrium
Surpluses
Shortages
Key Terms
Previous
際際滷
Next
際際滷
End
Show
P
Qo
$5
4
3
2
1
P QD
$5
4
3
2
1
10
20
35
55
80
D
Price of Corn
Quantity of Corn
CORN
10 20 30 40 50 60 70 80
--
10
20
40
60
D
Decrease
in
Demand
Decrease
in Quantity
Demanded
GRAPHING DEMAND
3 - 20
Copyright McGraw-Hill/Irwin, 2002
Markets
Demand Defined
Demand Graphed
Changes in Demand
Supply Defined
Supply Graphed
Changes in Supply
Equilibrium
Surpluses
Shortages
Key Terms
Previous
際際滷
Next
際際滷
End
Show
SUPPLY DEFINED
SUPPLY SCHEDULE
$1
2
3
4
5
P QS
CORN
Various Amounts
5
20
35
50
60
3 - 21
Copyright McGraw-Hill/Irwin, 2002
Markets
Demand Defined
Demand Graphed
Changes in Demand
Supply Defined
Supply Graphed
Changes in Supply
Equilibrium
Surpluses
Shortages
Key Terms
Previous
際際滷
Next
際際滷
End
Show
SUPPLY DEFINED
SUPPLY SCHEDULE
$1
2
3
4
5
P QS
CORN
Various Amounts
A Series of Possible Prices
a specified time period
other things being equal
5
20
35
50
60
3 - 22
Copyright McGraw-Hill/Irwin, 2002
Markets
Demand Defined
Demand Graphed
Changes in Demand
Supply Defined
Supply Graphed
Changes in Supply
Equilibrium
Surpluses
Shortages
Key Terms
Previous
際際滷
Next
際際滷
End
Show
LAW OF SUPPLY
 As Price Rises
Quantity Supplied Rises
 As Price Falls
Quantity Supplied Falls
A direct relationship exists between
price and quantity supplied
3 - 23
Copyright McGraw-Hill/Irwin, 2002
Markets
Demand Defined
Demand Graphed
Changes in Demand
Supply Defined
Supply Graphed
Changes in Supply
Equilibrium
Surpluses
Shortages
Key Terms
Previous
際際滷
Next
際際滷
End
Show
DETERMINANTS OF
SUPPLY
 Resource Prices
 Technology
 Taxes & Subsidies
 Prices of Other Goods
 Price Expectations
 Number of Sellers
3 - 24
Copyright McGraw-Hill/Irwin, 2002
Markets
Demand Defined
Demand Graphed
Changes in Demand
Supply Defined
Supply Graphed
Changes in Supply
Equilibrium
Surpluses
Shortages
Key Terms
Previous
際際滷
Next
際際滷
End
Show
5
P
Qo
$5
4
3
2
1
10 20 30 40 50 60 70 80
$5
4
3
2
1
60
50
35
20
5
P QS
Price of Corn
Quantity of Corn
CORN
Plot the Points
GRAPHING SUPPLY
3 - 25
Copyright McGraw-Hill/Irwin, 2002
Markets
Demand Defined
Demand Graphed
Changes in Demand
Supply Defined
Supply Graphed
Changes in Supply
Equilibrium
Surpluses
Shortages
Key Terms
Previous
際際滷
Next
際際滷
End
Show
P
Qo
$5
4
3
2
1
10 20 30 40 50 60 70 80
$5
4
3
2
1
60
50
35
20
5
P QS
Price of Corn
Quantity of Corn
CORN
Plot the Points
GRAPHING SUPPLY
3 - 26
Copyright McGraw-Hill/Irwin, 2002
Markets
Demand Defined
Demand Graphed
Changes in Demand
Supply Defined
Supply Graphed
Changes in Supply
Equilibrium
Surpluses
Shortages
Key Terms
Previous
際際滷
Next
際際滷
End
Show
35
P
Qo
$5
4
3
2
1
10 20 30 40 50 60 70 80
$5
4
3
2
1
60
50
35
20
5
P QS
Price of Corn
Quantity of Corn
CORN
Plot the Points
GRAPHING SUPPLY
3 - 27
Copyright McGraw-Hill/Irwin, 2002
Markets
Demand Defined
Demand Graphed
Changes in Demand
Supply Defined
Supply Graphed
Changes in Supply
Equilibrium
Surpluses
Shortages
Key Terms
Previous
際際滷
Next
際際滷
End
Show
P
Qo
$5
4
3
2
1
10 20 30 40 50 60 70 80
$5
4
3
2
1
60
50
35
20
5
P QS
Price of Corn
Quantity of Corn
CORN
Plot the Points
GRAPHING SUPPLY
3 - 28
Copyright McGraw-Hill/Irwin, 2002
Markets
Demand Defined
Demand Graphed
Changes in Demand
Supply Defined
Supply Graphed
Changes in Supply
Equilibrium
Surpluses
Shortages
Key Terms
Previous
際際滷
Next
際際滷
End
Show
P
Qo
$5
4
3
2
1
10 20 30 40 50 60 70 80
$5
4
3
2
1
60
50
35
20
5
P QS
Price of Corn
Quantity of Corn
CORN
Plot the Points
GRAPHING SUPPLY
3 - 29
Copyright McGraw-Hill/Irwin, 2002
Markets
Demand Defined
Demand Graphed
Changes in Demand
Supply Defined
Supply Graphed
Changes in Supply
Equilibrium
Surpluses
Shortages
Key Terms
Previous
際際滷
Next
際際滷
End
Show
S
P
Qo
$5
4
3
2
1
10 20 30 40 50 60 70 80
$5
4
3
2
1
60
50
35
20
5
P QS
Price of Corn
Quantity of Corn
CORN
Plot the Points
Connect the Points
GRAPHING SUPPLY
3 - 30
Copyright McGraw-Hill/Irwin, 2002
Markets
Demand Defined
Demand Graphed
Changes in Demand
Supply Defined
Supply Graphed
Changes in Supply
Equilibrium
Surpluses
Shortages
Key Terms
Previous
際際滷
Next
際際滷
End
Show
S
P
Qo
$5
4
3
2
1
10 20 30 40 50 60 70 80
$5
4
3
2
1
60
50
35
20
5
P QS
Price of Corn
Quantity of Corn
CORN
What if
Supply
Increases?
GRAPHING SUPPLY
3 - 31
Copyright McGraw-Hill/Irwin, 2002
Markets
Demand Defined
Demand Graphed
Changes in Demand
Supply Defined
Supply Graphed
Changes in Supply
Equilibrium
Surpluses
Shortages
Key Terms
Previous
際際滷
Next
際際滷
End
Show
S
P
Qo
$5
4
3
2
1
10 20 30 40 50 60 70 80
Price of Corn
Quantity of Corn
$5
4
3
2
1
60
50
35
20
5
P QS
CORN
80
70
60
45
30
SIncrease
in
Supply
Increase
in Quantity
Supplied
GRAPHING SUPPLY
3 - 32
Copyright McGraw-Hill/Irwin, 2002
Markets
Demand Defined
Demand Graphed
Changes in Demand
Supply Defined
Supply Graphed
Changes in Supply
Equilibrium
Surpluses
Shortages
Key Terms
Previous
際際滷
Next
際際滷
End
Show
S
P
Qo
$5
4
3
2
1
10 20 30 40 50 60 70 80
$5
4
3
2
1
60
50
35
20
5
P QS
Price of Corn
Quantity of Corn
CORN
What if
Supply
Decreases?
GRAPHING SUPPLY
3 - 33
Copyright McGraw-Hill/Irwin, 2002
Markets
Demand Defined
Demand Graphed
Changes in Demand
Supply Defined
Supply Graphed
Changes in Supply
Equilibrium
Surpluses
Shortages
Key Terms
Previous
際際滷
Next
際際滷
End
Show
S
P
Qo
$5
4
3
2
1
10 20 30 40 50 60 70 80
$5
4
3
2
1
60
50
35
20
5
P QS
Price of Corn
Quantity of Corn
CORN
S
45
30
20
0
--
Decrease
in
Supply
Decrease
in Quantity
Supplied
GRAPHING SUPPLY
3 - 34
Copyright McGraw-Hill/Irwin, 2002
Markets
Demand Defined
Demand Graphed
Changes in Demand
Supply Defined
Supply Graphed
Changes in Supply
Equilibrium
Surpluses
Shortages
Key Terms
Previous
際際滷
Next
際際滷
End
Show
S
P
Qo
$5
4
3
2
1
10 20 30 40 50 60 70 80
$5
4
3
2
1
60
50
35
20
5
P QS
Price of Corn
Quantity of Corn
CORN
Combining
with
Demand
GRAPHING SUPPLY
3 - 35
Copyright McGraw-Hill/Irwin, 2002
Markets
Demand Defined
Demand Graphed
Changes in Demand
Supply Defined
Supply Graphed
Changes in Supply
Equilibrium
Surpluses
Shortages
Key Terms
Previous
際際滷
Next
際際滷
End
Show
MARKET DEMAND &
SUPPLY
$5
4
3
2
1
10
20
35
55
80
$5
4
3
2
1
60
50
35
20
5
x
200
B
U
Y
E
R
S
P QD
BUSHELS
OF CORN
MARKET
DEMAND
2,000
4,000
7,000
11,000
16,000
x
200
S
E
L
L
E
R
S
12,000
10,000
7,000
4,000
1,000
P QS
BUSHELS
OF CORN
MARKET
SUPPLY
EQUILIBRIUM
Graphically
3 - 36
Copyright McGraw-Hill/Irwin, 2002
Markets
Demand Defined
Demand Graphed
Changes in Demand
Supply Defined
Supply Graphed
Changes in Supply
Equilibrium
Surpluses
Shortages
Key Terms
Previous
際際滷
Next
際際滷
End
Show
7
S
P
Qo
$5
4
3
2
1
2 4 6 8 10 12 14 16
P QD
$5
4
3
2
1
2,000
4,000
7,000
11,000
16,000
$5
4
3
2
1
12,000
10,000
7,000
4,000
1,000
D
P QS
Price of Corn
Quantity of Corn
CORN
MARKET
CORN
MARKET
Market
Clearing
Equilibrium
MARKET DEMAND &
SUPPLY
3 - 37
Copyright McGraw-Hill/Irwin, 2002
Markets
Demand Defined
Demand Graphed
Changes in Demand
Supply Defined
Supply Graphed
Changes in Supply
Equilibrium
Surpluses
Shortages
Key Terms
Previous
際際滷
Next
際際滷
End
Show
7
S
P
Qo
$5
4
3
2
1
2 4 6 8 10 12 14 16
P QD
$5
4
3
2
1
2,000
4,000
7,000
11,000
16,000
$5
4
3
2
1
12,000
10,000
7,000
4,000
1,000
D
P QS
Price of Corn
Quantity of Corn
CORN
MARKET
CORN
MARKETSurplus
At a $4 price
more is being
supplied than
demanded
MARKET DEMAND &
SUPPLY
3 - 38
Copyright McGraw-Hill/Irwin, 2002
Markets
Demand Defined
Demand Graphed
Changes in Demand
Supply Defined
Supply Graphed
Changes in Supply
Equilibrium
Surpluses
Shortages
Key Terms
Previous
際際滷
Next
際際滷
End
Show
117
S
P
Qo
$5
4
3
2
1
2 4 6 8 10 12 14 16
P QD
$5
4
3
2
1
2,000
4,000
7,000
11,000
16,000
$5
4
3
2
1
12,000
10,000
7,000
4,000
1,000
D
P QS
Price of Corn
Quantity of Corn
CORN
MARKET
CORN
MARKET
At a $2 price
more is being
demanded than
supplied
Shortage
MARKET DEMAND &
SUPPLY
3 - 39
Copyright McGraw-Hill/Irwin, 2002
Markets
Demand Defined
Demand Graphed
Changes in Demand
Supply Defined
Supply Graphed
Changes in Supply
Equilibrium
Surpluses
Shortages
Key Terms
Previous
際際滷
Next
際際滷
End
Show
MARKET EQUILIBRIUM
 Equilibrium Price & Quantity
 Rationing Function of Prices
 Changes in Demand
 Changes in Quantity
Demanded
 Changes in Supply
 Changes in Quantity Supplied
3 - 40
Copyright McGraw-Hill/Irwin, 2002
Markets
Demand Defined
Demand Graphed
Changes in Demand
Supply Defined
Supply Graphed
Changes in Supply
Equilibrium
Surpluses
Shortages
Key Terms
Previous
際際滷
Next
際際滷
End
Show
MARKET EQUILIBRIUM
 Equilibrium Price & Quantity
 Rationing Function of Prices
 Changes in Demand
 Changes in Quantity
Demanded
 Changes in Supply
 Changes in Quantity Supplied
Complex Cases
Multiple Shifts
3 - 41
Copyright McGraw-Hill/Irwin, 2002
Markets
Demand Defined
Demand Graphed
Changes in Demand
Supply Defined
Supply Graphed
Changes in Supply
Equilibrium
Surpluses
Shortages
Key Terms
Previous
際際滷
Next
際際滷
End
Show
 Equilibrium Price & Quantity
 Rationing Function of Prices
 Changes in Demand
 Changes in Quantity
Demanded
 Changes in Supply
 Changes in Quantity Supplied
Chapter
Conclusion
MARKET EQUILIBRIUM
Key Terms
market
demand
demand schedule
law of demand
diminishing marginal utility
income effect
substitution effect
demand curve
determinants of demand
normal goods
inferior goods
substitute good
complementary good
change in demand
change in quantity demanded
supply
supply schedule
law of supply
supply curve
determinants of supply
change in supply
change in quantity supplied
surplus
shortage
equilibrium price
equilibrium quantity
rationing function of prices
Copyright McGraw-Hill/Irwin, 2002 BACK END
3 - 43
Copyright McGraw-Hill/Irwin, 2002
Markets
Demand Defined
Demand Graphed
Changes in Demand
Supply Defined
Supply Graphed
Changes in Supply
Equilibrium
Surpluses
Shortages
Key Terms
Previous
際際滷
Next
際際滷
End
Show
Next:
Chapter 4
Ad

Recommended

Carbaugh ch03
Carbaugh ch03
MohamedEisse
Agma
Agma
Karl Obispo
Colliers North American Industrial Highlights Q1 2013
Coy Davidson
Circular flow
Circular flow
agjohnson
Equilibrium
Equilibrium
agjohnson
Supply
Supply
agjohnson
Demand
Demand
agjohnson
Opportunity cost powerpoint
agjohnson
Aggregate Supply
Aggregate Supply
agjohnson
Chap003
Chap003
starickam
Chap003a
Chap003a
starickam
Chap003
Chap003
starickam
Chap003
Chap003
starickam
Pertemuan ii mankiw krugman
stephaniejessey
Chapter-3-Lovewell (1).ppt
intisharakib9
Chap03
Chap03
Mr. Pauly's Classes
demand n supply
demand n supply
Mohzin Chohan
Econ606 Chapter 03 2020
sakanor
demand and supply
demand and supply
Kaushik Samanta
Chap038
Chap038
agjohnson
Chap037
Chap037
agjohnson
19 disputes
19 disputes
agjohnson
Deficits & debt
Deficits & debt
agjohnson
Econ growth
Econ growth
agjohnson
15 interest rates and monetary policy new
agjohnson
14 creating money new
agjohnson
Demand and supply money
agjohnson
13 money and banking new
agjohnson
Fiscal policy
Fiscal policy
agjohnson
Gdp, inflation, and business cycles
agjohnson

More Related Content

Similar to Markets (11)

Aggregate Supply
Aggregate Supply
agjohnson
Chap003
Chap003
starickam
Chap003a
Chap003a
starickam
Chap003
Chap003
starickam
Chap003
Chap003
starickam
Pertemuan ii mankiw krugman
stephaniejessey
Chapter-3-Lovewell (1).ppt
intisharakib9
Chap03
Chap03
Mr. Pauly's Classes
demand n supply
demand n supply
Mohzin Chohan
Econ606 Chapter 03 2020
sakanor
demand and supply
demand and supply
Kaushik Samanta
Aggregate Supply
Aggregate Supply
agjohnson
Pertemuan ii mankiw krugman
stephaniejessey
Chapter-3-Lovewell (1).ppt
intisharakib9
Econ606 Chapter 03 2020
sakanor

More from agjohnson (20)

Chap038
Chap038
agjohnson
Chap037
Chap037
agjohnson
19 disputes
19 disputes
agjohnson
Deficits & debt
Deficits & debt
agjohnson
Econ growth
Econ growth
agjohnson
15 interest rates and monetary policy new
agjohnson
14 creating money new
agjohnson
Demand and supply money
agjohnson
13 money and banking new
agjohnson
Fiscal policy
Fiscal policy
agjohnson
Gdp, inflation, and business cycles
agjohnson
Aggregate spending _saving__and_consumpt
agjohnson
Unemployment
Unemployment
agjohnson
Gdp
Gdp
agjohnson
Wage determination
Wage determination
agjohnson
Demand for resources
agjohnson
Monopoly
Monopoly
agjohnson
Monopoly decisions
Monopoly decisions
agjohnson
Mono comp __oligopoly___game_theory
agjohnson
Oligopoly
Oligopoly
agjohnson
19 disputes
19 disputes
agjohnson
Deficits & debt
Deficits & debt
agjohnson
Econ growth
Econ growth
agjohnson
15 interest rates and monetary policy new
agjohnson
14 creating money new
agjohnson
Demand and supply money
agjohnson
13 money and banking new
agjohnson
Fiscal policy
Fiscal policy
agjohnson
Gdp, inflation, and business cycles
agjohnson
Aggregate spending _saving__and_consumpt
agjohnson
Unemployment
Unemployment
agjohnson
Wage determination
Wage determination
agjohnson
Demand for resources
agjohnson
Monopoly decisions
Monopoly decisions
agjohnson
Mono comp __oligopoly___game_theory
agjohnson
Oligopoly
Oligopoly
agjohnson
Ad

Markets

  • 1. 3 - 1 Copyright McGraw-Hill/Irwin, 2002 Markets Demand Defined Demand Graphed Changes in Demand Supply Defined Supply Graphed Changes in Supply Equilibrium Surpluses Shortages Key Terms Previous 際際滷 Next 際際滷 End Show Individual Markets Demand & Supply 3C H A P T E R
  • 2. 3 - 2 Copyright McGraw-Hill/Irwin, 2002 Markets Demand Defined Demand Graphed Changes in Demand Supply Defined Supply Graphed Changes in Supply Equilibrium Surpluses Shortages Key Terms Previous 際際滷 Next 際際滷 End Show MARKETS DEFINED MARKETS POTENTIAL SELLERS POTENTIAL BUYERS
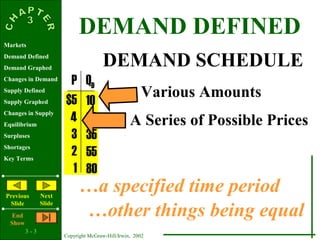
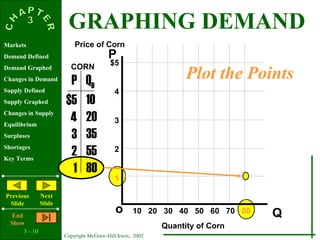
  • 3. 3 - 3 Copyright McGraw-Hill/Irwin, 2002 Markets Demand Defined Demand Graphed Changes in Demand Supply Defined Supply Graphed Changes in Supply Equilibrium Surpluses Shortages Key Terms Previous 際際滷 Next 際際滷 End Show $5 4 3 2 1 DEMAND DEFINED DEMAND SCHEDULE Various Amounts A Series of Possible Prices a specified time period other things being equal P QD 10 20 35 55 80
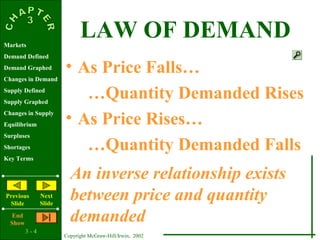
  • 4. 3 - 4 Copyright McGraw-Hill/Irwin, 2002 Markets Demand Defined Demand Graphed Changes in Demand Supply Defined Supply Graphed Changes in Supply Equilibrium Surpluses Shortages Key Terms Previous 際際滷 Next 際際滷 End Show LAW OF DEMAND As Price Falls Quantity Demanded Rises As Price Rises Quantity Demanded Falls An inverse relationship exists between price and quantity demanded
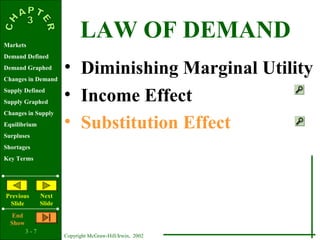
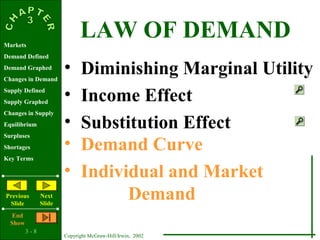
  • 5. 3 - 5 Copyright McGraw-Hill/Irwin, 2002 Markets Demand Defined Demand Graphed Changes in Demand Supply Defined Supply Graphed Changes in Supply Equilibrium Surpluses Shortages Key Terms Previous 際際滷 Next 際際滷 End Show Diminishing Marginal Utility LAW OF DEMAND
  • 6. 3 - 6 Copyright McGraw-Hill/Irwin, 2002 Markets Demand Defined Demand Graphed Changes in Demand Supply Defined Supply Graphed Changes in Supply Equilibrium Surpluses Shortages Key Terms Previous 際際滷 Next 際際滷 End Show Diminishing Marginal Utility LAW OF DEMAND Income Effect
  • 7. 3 - 7 Copyright McGraw-Hill/Irwin, 2002 Markets Demand Defined Demand Graphed Changes in Demand Supply Defined Supply Graphed Changes in Supply Equilibrium Surpluses Shortages Key Terms Previous 際際滷 Next 際際滷 End Show Diminishing Marginal Utility LAW OF DEMAND Income Effect Substitution Effect
  • 8. 3 - 8 Copyright McGraw-Hill/Irwin, 2002 Markets Demand Defined Demand Graphed Changes in Demand Supply Defined Supply Graphed Changes in Supply Equilibrium Surpluses Shortages Key Terms Previous 際際滷 Next 際際滷 End Show Diminishing Marginal Utility Income Effect Substitution Effect LAW OF DEMAND Demand Curve Individual and Market Demand
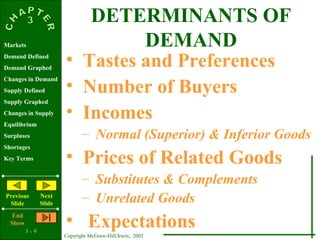
  • 9. 3 - 9 Copyright McGraw-Hill/Irwin, 2002 Markets Demand Defined Demand Graphed Changes in Demand Supply Defined Supply Graphed Changes in Supply Equilibrium Surpluses Shortages Key Terms Previous 際際滷 Next 際際滷 End Show DETERMINANTS OF DEMAND Tastes and Preferences Number of Buyers Incomes Normal (Superior) & Inferior Goods Prices of Related Goods Substitutes & Complements Unrelated Goods Expectations
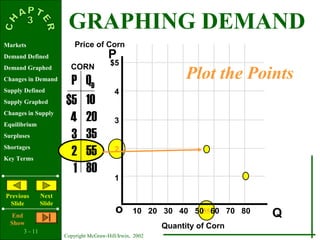
  • 10. 3 - 10 Copyright McGraw-Hill/Irwin, 2002 Markets Demand Defined Demand Graphed Changes in Demand Supply Defined Supply Graphed Changes in Supply Equilibrium Surpluses Shortages Key Terms Previous 際際滷 Next 際際滷 End Show GRAPHING DEMAND P Qo $5 4 3 2 1 P QD $5 4 3 2 1 10 20 35 55 80 Price of Corn Quantity of Corn CORN Plot the Points 10 20 30 40 50 60 70 80
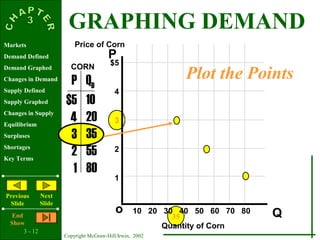
  • 11. 3 - 11 Copyright McGraw-Hill/Irwin, 2002 Markets Demand Defined Demand Graphed Changes in Demand Supply Defined Supply Graphed Changes in Supply Equilibrium Surpluses Shortages Key Terms Previous 際際滷 Next 際際滷 End Show 55 P Qo $5 4 3 2 1 P QD $5 4 3 2 1 10 20 35 55 80 Price of Corn Quantity of Corn CORN Plot the Points 10 20 30 40 50 60 70 80 GRAPHING DEMAND
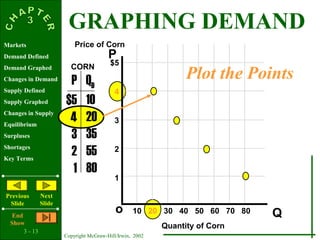
  • 12. 3 - 12 Copyright McGraw-Hill/Irwin, 2002 Markets Demand Defined Demand Graphed Changes in Demand Supply Defined Supply Graphed Changes in Supply Equilibrium Surpluses Shortages Key Terms Previous 際際滷 Next 際際滷 End Show 35 P Qo $5 4 3 2 1 P QD $5 4 3 2 1 10 20 35 55 80 Price of Corn Quantity of Corn CORN Plot the Points 10 20 30 40 50 60 70 80 GRAPHING DEMAND
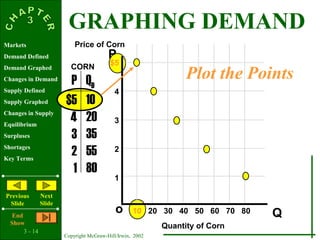
  • 13. 3 - 13 Copyright McGraw-Hill/Irwin, 2002 Markets Demand Defined Demand Graphed Changes in Demand Supply Defined Supply Graphed Changes in Supply Equilibrium Surpluses Shortages Key Terms Previous 際際滷 Next 際際滷 End Show P Qo $5 4 3 2 1 P QD $5 4 3 2 1 10 20 35 55 80 Price of Corn Quantity of Corn CORN Plot the Points 10 20 30 40 50 60 70 80 GRAPHING DEMAND
  • 14. 3 - 14 Copyright McGraw-Hill/Irwin, 2002 Markets Demand Defined Demand Graphed Changes in Demand Supply Defined Supply Graphed Changes in Supply Equilibrium Surpluses Shortages Key Terms Previous 際際滷 Next 際際滷 End Show P Qo $5 4 3 2 1 P QD $5 4 3 2 1 10 20 35 55 80 Price of Corn Quantity of Corn CORN Plot the Points 10 20 30 40 50 60 70 80 GRAPHING DEMAND
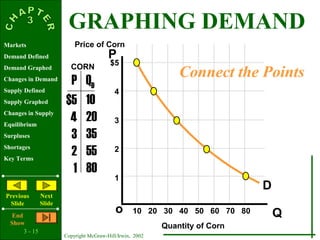
  • 15. 3 - 15 Copyright McGraw-Hill/Irwin, 2002 Markets Demand Defined Demand Graphed Changes in Demand Supply Defined Supply Graphed Changes in Supply Equilibrium Surpluses Shortages Key Terms Previous 際際滷 Next 際際滷 End Show P Qo $5 4 3 2 1 P QD $5 4 3 2 1 10 20 35 55 80 D Price of Corn Quantity of Corn CORN Connect the Points 10 20 30 40 50 60 70 80 GRAPHING DEMAND
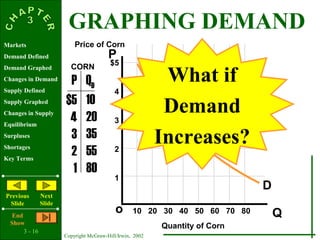
  • 16. 3 - 16 Copyright McGraw-Hill/Irwin, 2002 Markets Demand Defined Demand Graphed Changes in Demand Supply Defined Supply Graphed Changes in Supply Equilibrium Surpluses Shortages Key Terms Previous 際際滷 Next 際際滷 End Show P Qo $5 4 3 2 1 P QD $5 4 3 2 1 10 20 35 55 80 D Price of Corn Quantity of Corn CORN 10 20 30 40 50 60 70 80 What if Demand Increases? GRAPHING DEMAND
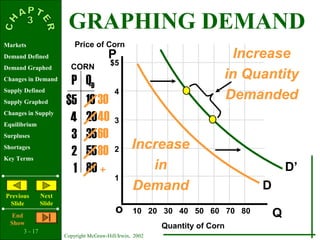
  • 17. 3 - 17 Copyright McGraw-Hill/Irwin, 2002 Markets Demand Defined Demand Graphed Changes in Demand Supply Defined Supply Graphed Changes in Supply Equilibrium Surpluses Shortages Key Terms Previous 際際滷 Next 際際滷 End Show P Qo $5 4 3 2 1 P QD $5 4 3 2 1 D Price of Corn Quantity of Corn CORN 10 20 30 40 50 60 70 80 D Increase in Demand Increase in Quantity Demanded10 20 35 55 80 30 40 60 80 + GRAPHING DEMAND
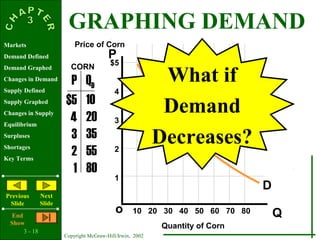
  • 18. 3 - 18 Copyright McGraw-Hill/Irwin, 2002 Markets Demand Defined Demand Graphed Changes in Demand Supply Defined Supply Graphed Changes in Supply Equilibrium Surpluses Shortages Key Terms Previous 際際滷 Next 際際滷 End Show P Qo $5 4 3 2 1 P QD $5 4 3 2 1 10 20 35 55 80 D Price of Corn Quantity of Corn CORN 10 20 30 40 50 60 70 80 What if Demand Decreases? GRAPHING DEMAND
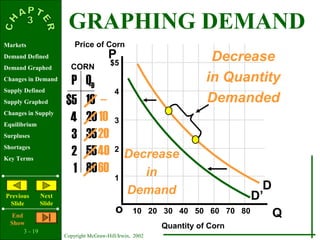
  • 19. 3 - 19 Copyright McGraw-Hill/Irwin, 2002 Markets Demand Defined Demand Graphed Changes in Demand Supply Defined Supply Graphed Changes in Supply Equilibrium Surpluses Shortages Key Terms Previous 際際滷 Next 際際滷 End Show P Qo $5 4 3 2 1 P QD $5 4 3 2 1 10 20 35 55 80 D Price of Corn Quantity of Corn CORN 10 20 30 40 50 60 70 80 -- 10 20 40 60 D Decrease in Demand Decrease in Quantity Demanded GRAPHING DEMAND
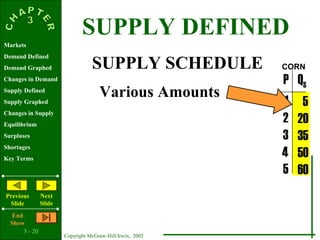
  • 20. 3 - 20 Copyright McGraw-Hill/Irwin, 2002 Markets Demand Defined Demand Graphed Changes in Demand Supply Defined Supply Graphed Changes in Supply Equilibrium Surpluses Shortages Key Terms Previous 際際滷 Next 際際滷 End Show SUPPLY DEFINED SUPPLY SCHEDULE $1 2 3 4 5 P QS CORN Various Amounts 5 20 35 50 60
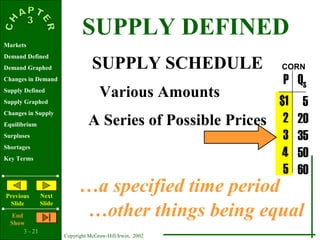
  • 21. 3 - 21 Copyright McGraw-Hill/Irwin, 2002 Markets Demand Defined Demand Graphed Changes in Demand Supply Defined Supply Graphed Changes in Supply Equilibrium Surpluses Shortages Key Terms Previous 際際滷 Next 際際滷 End Show SUPPLY DEFINED SUPPLY SCHEDULE $1 2 3 4 5 P QS CORN Various Amounts A Series of Possible Prices a specified time period other things being equal 5 20 35 50 60
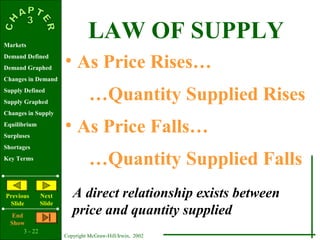
  • 22. 3 - 22 Copyright McGraw-Hill/Irwin, 2002 Markets Demand Defined Demand Graphed Changes in Demand Supply Defined Supply Graphed Changes in Supply Equilibrium Surpluses Shortages Key Terms Previous 際際滷 Next 際際滷 End Show LAW OF SUPPLY As Price Rises Quantity Supplied Rises As Price Falls Quantity Supplied Falls A direct relationship exists between price and quantity supplied
  • 23. 3 - 23 Copyright McGraw-Hill/Irwin, 2002 Markets Demand Defined Demand Graphed Changes in Demand Supply Defined Supply Graphed Changes in Supply Equilibrium Surpluses Shortages Key Terms Previous 際際滷 Next 際際滷 End Show DETERMINANTS OF SUPPLY Resource Prices Technology Taxes & Subsidies Prices of Other Goods Price Expectations Number of Sellers
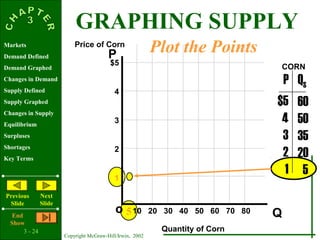
  • 24. 3 - 24 Copyright McGraw-Hill/Irwin, 2002 Markets Demand Defined Demand Graphed Changes in Demand Supply Defined Supply Graphed Changes in Supply Equilibrium Surpluses Shortages Key Terms Previous 際際滷 Next 際際滷 End Show 5 P Qo $5 4 3 2 1 10 20 30 40 50 60 70 80 $5 4 3 2 1 60 50 35 20 5 P QS Price of Corn Quantity of Corn CORN Plot the Points GRAPHING SUPPLY
  • 25. 3 - 25 Copyright McGraw-Hill/Irwin, 2002 Markets Demand Defined Demand Graphed Changes in Demand Supply Defined Supply Graphed Changes in Supply Equilibrium Surpluses Shortages Key Terms Previous 際際滷 Next 際際滷 End Show P Qo $5 4 3 2 1 10 20 30 40 50 60 70 80 $5 4 3 2 1 60 50 35 20 5 P QS Price of Corn Quantity of Corn CORN Plot the Points GRAPHING SUPPLY
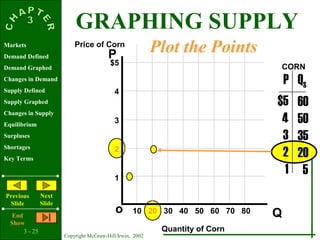
  • 26. 3 - 26 Copyright McGraw-Hill/Irwin, 2002 Markets Demand Defined Demand Graphed Changes in Demand Supply Defined Supply Graphed Changes in Supply Equilibrium Surpluses Shortages Key Terms Previous 際際滷 Next 際際滷 End Show 35 P Qo $5 4 3 2 1 10 20 30 40 50 60 70 80 $5 4 3 2 1 60 50 35 20 5 P QS Price of Corn Quantity of Corn CORN Plot the Points GRAPHING SUPPLY
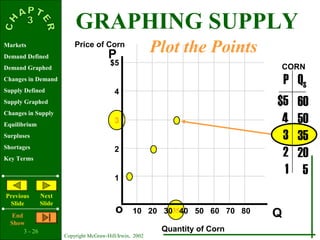
  • 27. 3 - 27 Copyright McGraw-Hill/Irwin, 2002 Markets Demand Defined Demand Graphed Changes in Demand Supply Defined Supply Graphed Changes in Supply Equilibrium Surpluses Shortages Key Terms Previous 際際滷 Next 際際滷 End Show P Qo $5 4 3 2 1 10 20 30 40 50 60 70 80 $5 4 3 2 1 60 50 35 20 5 P QS Price of Corn Quantity of Corn CORN Plot the Points GRAPHING SUPPLY
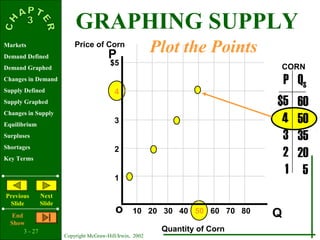
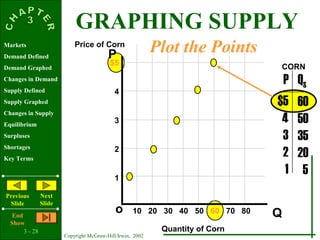
  • 28. 3 - 28 Copyright McGraw-Hill/Irwin, 2002 Markets Demand Defined Demand Graphed Changes in Demand Supply Defined Supply Graphed Changes in Supply Equilibrium Surpluses Shortages Key Terms Previous 際際滷 Next 際際滷 End Show P Qo $5 4 3 2 1 10 20 30 40 50 60 70 80 $5 4 3 2 1 60 50 35 20 5 P QS Price of Corn Quantity of Corn CORN Plot the Points GRAPHING SUPPLY
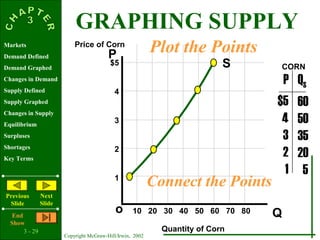
  • 29. 3 - 29 Copyright McGraw-Hill/Irwin, 2002 Markets Demand Defined Demand Graphed Changes in Demand Supply Defined Supply Graphed Changes in Supply Equilibrium Surpluses Shortages Key Terms Previous 際際滷 Next 際際滷 End Show S P Qo $5 4 3 2 1 10 20 30 40 50 60 70 80 $5 4 3 2 1 60 50 35 20 5 P QS Price of Corn Quantity of Corn CORN Plot the Points Connect the Points GRAPHING SUPPLY
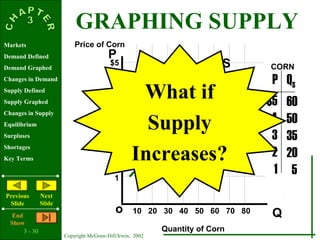
  • 30. 3 - 30 Copyright McGraw-Hill/Irwin, 2002 Markets Demand Defined Demand Graphed Changes in Demand Supply Defined Supply Graphed Changes in Supply Equilibrium Surpluses Shortages Key Terms Previous 際際滷 Next 際際滷 End Show S P Qo $5 4 3 2 1 10 20 30 40 50 60 70 80 $5 4 3 2 1 60 50 35 20 5 P QS Price of Corn Quantity of Corn CORN What if Supply Increases? GRAPHING SUPPLY
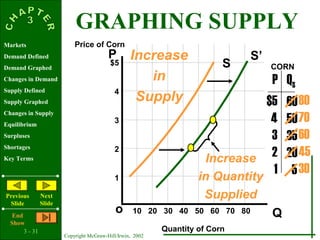
  • 31. 3 - 31 Copyright McGraw-Hill/Irwin, 2002 Markets Demand Defined Demand Graphed Changes in Demand Supply Defined Supply Graphed Changes in Supply Equilibrium Surpluses Shortages Key Terms Previous 際際滷 Next 際際滷 End Show S P Qo $5 4 3 2 1 10 20 30 40 50 60 70 80 Price of Corn Quantity of Corn $5 4 3 2 1 60 50 35 20 5 P QS CORN 80 70 60 45 30 SIncrease in Supply Increase in Quantity Supplied GRAPHING SUPPLY
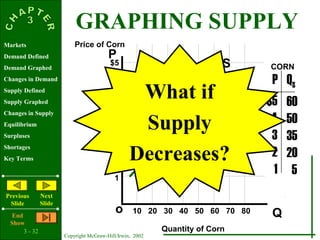
  • 32. 3 - 32 Copyright McGraw-Hill/Irwin, 2002 Markets Demand Defined Demand Graphed Changes in Demand Supply Defined Supply Graphed Changes in Supply Equilibrium Surpluses Shortages Key Terms Previous 際際滷 Next 際際滷 End Show S P Qo $5 4 3 2 1 10 20 30 40 50 60 70 80 $5 4 3 2 1 60 50 35 20 5 P QS Price of Corn Quantity of Corn CORN What if Supply Decreases? GRAPHING SUPPLY
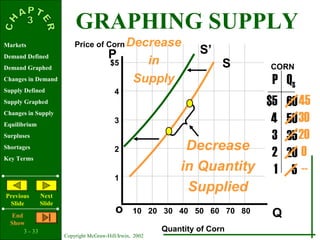
  • 33. 3 - 33 Copyright McGraw-Hill/Irwin, 2002 Markets Demand Defined Demand Graphed Changes in Demand Supply Defined Supply Graphed Changes in Supply Equilibrium Surpluses Shortages Key Terms Previous 際際滷 Next 際際滷 End Show S P Qo $5 4 3 2 1 10 20 30 40 50 60 70 80 $5 4 3 2 1 60 50 35 20 5 P QS Price of Corn Quantity of Corn CORN S 45 30 20 0 -- Decrease in Supply Decrease in Quantity Supplied GRAPHING SUPPLY
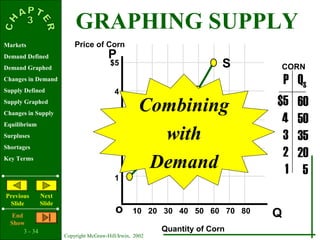
  • 34. 3 - 34 Copyright McGraw-Hill/Irwin, 2002 Markets Demand Defined Demand Graphed Changes in Demand Supply Defined Supply Graphed Changes in Supply Equilibrium Surpluses Shortages Key Terms Previous 際際滷 Next 際際滷 End Show S P Qo $5 4 3 2 1 10 20 30 40 50 60 70 80 $5 4 3 2 1 60 50 35 20 5 P QS Price of Corn Quantity of Corn CORN Combining with Demand GRAPHING SUPPLY
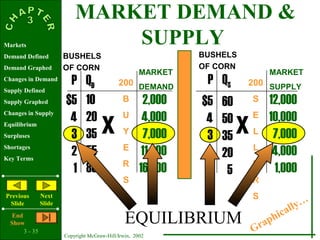
  • 35. 3 - 35 Copyright McGraw-Hill/Irwin, 2002 Markets Demand Defined Demand Graphed Changes in Demand Supply Defined Supply Graphed Changes in Supply Equilibrium Surpluses Shortages Key Terms Previous 際際滷 Next 際際滷 End Show MARKET DEMAND & SUPPLY $5 4 3 2 1 10 20 35 55 80 $5 4 3 2 1 60 50 35 20 5 x 200 B U Y E R S P QD BUSHELS OF CORN MARKET DEMAND 2,000 4,000 7,000 11,000 16,000 x 200 S E L L E R S 12,000 10,000 7,000 4,000 1,000 P QS BUSHELS OF CORN MARKET SUPPLY EQUILIBRIUM Graphically
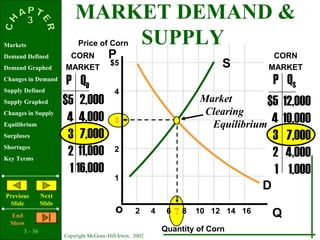
  • 36. 3 - 36 Copyright McGraw-Hill/Irwin, 2002 Markets Demand Defined Demand Graphed Changes in Demand Supply Defined Supply Graphed Changes in Supply Equilibrium Surpluses Shortages Key Terms Previous 際際滷 Next 際際滷 End Show 7 S P Qo $5 4 3 2 1 2 4 6 8 10 12 14 16 P QD $5 4 3 2 1 2,000 4,000 7,000 11,000 16,000 $5 4 3 2 1 12,000 10,000 7,000 4,000 1,000 D P QS Price of Corn Quantity of Corn CORN MARKET CORN MARKET Market Clearing Equilibrium MARKET DEMAND & SUPPLY
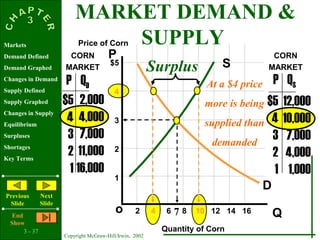
  • 37. 3 - 37 Copyright McGraw-Hill/Irwin, 2002 Markets Demand Defined Demand Graphed Changes in Demand Supply Defined Supply Graphed Changes in Supply Equilibrium Surpluses Shortages Key Terms Previous 際際滷 Next 際際滷 End Show 7 S P Qo $5 4 3 2 1 2 4 6 8 10 12 14 16 P QD $5 4 3 2 1 2,000 4,000 7,000 11,000 16,000 $5 4 3 2 1 12,000 10,000 7,000 4,000 1,000 D P QS Price of Corn Quantity of Corn CORN MARKET CORN MARKETSurplus At a $4 price more is being supplied than demanded MARKET DEMAND & SUPPLY
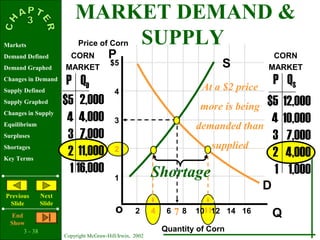
  • 38. 3 - 38 Copyright McGraw-Hill/Irwin, 2002 Markets Demand Defined Demand Graphed Changes in Demand Supply Defined Supply Graphed Changes in Supply Equilibrium Surpluses Shortages Key Terms Previous 際際滷 Next 際際滷 End Show 117 S P Qo $5 4 3 2 1 2 4 6 8 10 12 14 16 P QD $5 4 3 2 1 2,000 4,000 7,000 11,000 16,000 $5 4 3 2 1 12,000 10,000 7,000 4,000 1,000 D P QS Price of Corn Quantity of Corn CORN MARKET CORN MARKET At a $2 price more is being demanded than supplied Shortage MARKET DEMAND & SUPPLY
  • 39. 3 - 39 Copyright McGraw-Hill/Irwin, 2002 Markets Demand Defined Demand Graphed Changes in Demand Supply Defined Supply Graphed Changes in Supply Equilibrium Surpluses Shortages Key Terms Previous 際際滷 Next 際際滷 End Show MARKET EQUILIBRIUM Equilibrium Price & Quantity Rationing Function of Prices Changes in Demand Changes in Quantity Demanded Changes in Supply Changes in Quantity Supplied
  • 40. 3 - 40 Copyright McGraw-Hill/Irwin, 2002 Markets Demand Defined Demand Graphed Changes in Demand Supply Defined Supply Graphed Changes in Supply Equilibrium Surpluses Shortages Key Terms Previous 際際滷 Next 際際滷 End Show MARKET EQUILIBRIUM Equilibrium Price & Quantity Rationing Function of Prices Changes in Demand Changes in Quantity Demanded Changes in Supply Changes in Quantity Supplied Complex Cases Multiple Shifts
  • 41. 3 - 41 Copyright McGraw-Hill/Irwin, 2002 Markets Demand Defined Demand Graphed Changes in Demand Supply Defined Supply Graphed Changes in Supply Equilibrium Surpluses Shortages Key Terms Previous 際際滷 Next 際際滷 End Show Equilibrium Price & Quantity Rationing Function of Prices Changes in Demand Changes in Quantity Demanded Changes in Supply Changes in Quantity Supplied Chapter Conclusion MARKET EQUILIBRIUM
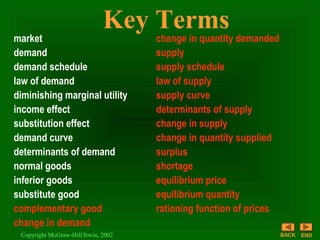
  • 42. Key Terms market demand demand schedule law of demand diminishing marginal utility income effect substitution effect demand curve determinants of demand normal goods inferior goods substitute good complementary good change in demand change in quantity demanded supply supply schedule law of supply supply curve determinants of supply change in supply change in quantity supplied surplus shortage equilibrium price equilibrium quantity rationing function of prices Copyright McGraw-Hill/Irwin, 2002 BACK END
  • 43. 3 - 43 Copyright McGraw-Hill/Irwin, 2002 Markets Demand Defined Demand Graphed Changes in Demand Supply Defined Supply Graphed Changes in Supply Equilibrium Surpluses Shortages Key Terms Previous 際際滷 Next 際際滷 End Show Next: Chapter 4