Math 5076 Project 2
Download as pptx, pdf2 likes169 views
The document compares different models for estimating volatility over time: the equal weight model, EWMA, and GARCH(1,1). The equal weight model treats all past observations equally, while EWMA gives more recent observations greater weight. GARCH(1,1) incorporates mean reversion, making it theoretically more appealing. These models are applied to a portfolio of stocks to estimate volatility on a future date. EWMA produces higher volatility estimates as it weights recent high volatility more. While GARCH(1,1) fits well, the document concludes by questioning which model provides the best volatility estimates.
1 of 15
Downloaded 25 times


Ad
Recommended
The future of Retail
The future of RetailJane Ball
╠²
The document discusses the impact of Black Friday on retail stores, highlighting consumer spending, retailer responses, and operational challenges. It emphasizes that while promotions drive foot traffic, they strain resources, affect retail standards, and can damage brand equity if not managed properly. Recommendations for success include careful planning, maintaining merchandising standards, and ensuring a positive shopping experience for all customers.Di Wu's Undergraduate Thesis_UMN
Di Wu's Undergraduate Thesis_UMNDi Wu
╠²
This document is a thesis submitted by Di Wu to the University Honors Program at the University of Minnesota-Twin Cities in partial fulfillment of the requirements for the degree of Bachelor of Arts, summa cum laude in Mathematics. The thesis explores whether there exists a set in the real numbers that is not almost open but still measurable. It begins by defining concepts such as nowhere dense sets, meager sets, almost open sets, and negligible sets. It then discusses examples like the Cantor set that are nowhere dense and meager. The goal is to use these concepts and examples to construct a set that is not almost open but still measurable.Math 5076 Project 1
Math 5076 Project 1Di Wu
╠²
This document compares different computational finance methods for pricing options on Apple (AAPL) stock, including trinomial trees, Monte Carlo simulation, and real market prices. It presents the assumptions and input parameters used, such as AAPL's stock price, volatility, risk-free rate, and dividend yield. The results of pricing a call and put option on AAPL stock using various methods are shown in a table, along with the real market prices. The document also discusses using Matlab functions and code to implement the trinomial tree and Monte Carlo methods.Iwsm2014 exponentially weighted moving average prediction in the software d...
Iwsm2014 exponentially weighted moving average prediction in the software d...Nesma
╠²
This document discusses the use of short-run control charts, specifically Q-control charts, for monitoring the software development process. It provides background on statistical process control and challenges with applying conventional control charts to software processes due to the lack of large historical datasets. Q-control charts are presented as an alternative that can begin monitoring early in a process using a small amount of data and update limits over time. Examples of Q-control charts applied to defect types from software projects are shown and merging of multiple Q-charts is demonstrated. Outlier handling and exponentially weighted moving average Q-charts with forecasting capabilities are also described.Black-Litterman.ppt-advance portfolio tech
Black-Litterman.ppt-advance portfolio techHammadUlHaque1
╠²
Black and litterman portfolio management techniques2. Module II (1) FRM.pdf
2. Module II (1) FRM.pdfItzGA
╠²
The document discusses various methods of measuring risk and volatility in investments. It defines key terms like return, risk, standard deviation and volatility. It then explains different models used to measure volatility like EWMA, ARCH, GARCH and VaR. For EWMA, it provides the formula and explains how it is used to estimate volatility. For ARCH and GARCH models, it describes the concepts and formulas for ARCH(1), GARCH(1,1) and how they model conditional heteroskedasticity. Finally, it explains the variance-covariance and Monte Carlo methods to calculate Value at Risk (VaR).Modelling the rate of treasury bills in ghana
Modelling the rate of treasury bills in ghanaAlexander Decker
╠²
This document summarizes a study that empirically models the monthly Treasury bill rates in Ghana from 1998 to 2012. Specifically, it models the rates of the 91-day and 182-day Treasury bills using ARIMA models. For the 91-day bills, the ARIMA 3,1,1 model provided the best fit with a log likelihood value of -328.58. For the 182-day bills, the ARIMA 1,1,0 model fit best with a log likelihood value of -356.50. Residual tests on both models showed the residuals were free from heteroscedasticity and serial correlation. The study aims to determine appropriate time series models for predicting and forecasting future Treasury bill rates inneed to realize in r studio (regression).pptx
need to realize in r studio (regression).pptxSmarajitPaulChoudhur
╠²
The document discusses using a vector autoregressive (VAR) model to analyze the relationship between stock returns and credit default swap (CDS) spreads of firms over time. It identifies stock returns and CDS spreads as dependent variables, and volatility, financial leverage, and other firm metrics as explanatory and control variables. The conceptual framework involves estimating two equations using ordinary least squares regression with one-period lagged returns as explanatory variables to avoid autocorrelation.Dummy variables
Dummy variablesdineshsahejpal
╠²
This document discusses the use of dummy variables in financial econometrics. Dummy variables can be used to correct for non-normality in the error term, which is often caused by outliers in financial data. An impulse dummy variable that takes the value of 1 for the outlier observation can force the residual to 0. Dummy variables can also model qualitative effects, seasonal effects, and changes in the intercept or slope of the regression line over time. The Bera-Jarque test is used to test whether the error term is normally distributed.Dummy variables - title
Dummy variables - titleMehul Mohan
╠²
This document discusses the use of dummy variables in financial econometrics. Dummy variables can be used to correct for non-normality in data by accounting for outliers. They can also model qualitative effects by taking values of 0 or 1. The document examines intercept dummy variables, which control for changes in the intercept, and slope dummy variables, which control for changes in the slope of the regression line. Dummy variables are a useful tool for testing for structural breaks in data.Dummy variables xd
Dummy variables xdteachersdotcom
╠²
The document discusses the use of dummy variables in financial econometrics, highlighting their role in addressing issues of normality in regression models through techniques such as the Bera-Jarque test. It explains the implications of incorporating dummy variables for outliers and differentiates between different types of dummy variables, including intercept and slope dummies. Additionally, it examines the testing for structural stability using dummy variables to understand changes in regression relationships over time.Dummy variables (1)
Dummy variables (1)dinesh sharma
╠²
This document discusses the use of dummy variables in financial econometrics. Dummy variables can be used to correct for non-normality in data by accounting for outliers. They can also model qualitative effects by taking values of 0 or 1. The document examines intercept dummy variables, which control for changes in the intercept, and slope dummy variables, which control for changes in the slope of the regression line. Dummy variables are a useful tool for testing for structural breaks and stability in time series regressions.Case study of s&p 500
Case study of s&p 500Professional Training Academy
╠²
This document summarizes a case study analyzing rules for mining data from the S&P 500 stock market index. It discusses potential biases in backtesting rules to select superior performers and statistical methods to minimize these biases. Specific topics covered include data mining biases, techniques to avoid data snooping bias by splitting samples, defining the case study statistically, transforming data series into market positions with rules, constructing technical analysis indicators from price and volume data, and categories of rules examined including trends, extremes/transitions, and divergence.Cmt learning objective 36 case study of s&p 500
Cmt learning objective 36 case study of s&p 500Professional Training Academy
╠²
This document discusses a case study that analyzed over 6,400 rules for trading the S&P 500 using data mining techniques. It describes how data mining bias can lead to overstating a rule's expected future performance. The case study used statistical inference tests like White's reality check and Masters' Monte-Carlo permutation method to minimize this bias. It details the various rule types analyzed, including trends, extremes/transitions, and divergence. Input data series included raw time series, indicators, and other preprocessed data. The goal was to identify rules with genuine predictive power and evaluate their statistical and practical significance.Time Series Analysis.pptx
Time Series Analysis.pptxSunny429247
╠²
Time series data are observations collected over time on one or more variables. Time series data can be used to analyze problems involving changes over time, such as stock prices, GDP, and exchange rates. Time series data must be stationary, meaning that its statistical properties like mean and variance do not change over time, to avoid spurious regressions. Non-stationary time series can be transformed to become stationary through differencing, removing trends, or taking logs. Common time series models like ARIMA rely on stationary data.Time series and panel data in econometrics
Time series and panel data in econometricsTorajInteaash2
╠²
This document discusses various time series and panel data techniques used in econometrics. It defines secondary data and describes classifications of time series analysis including linear time series models such as linear regression, simultaneous equation models, vector autoregressive (VAR) models, and univariate time series models like autoregressive (AR), moving average (MA), and autoregressive integrated moving average (ARIMA) models. It also discusses panel data analysis techniques including panel regression models, fixed and random effects models, and tests for unit roots, cointegration, and stationarity.Beware of Low Frequency Data by Ernie Chan, Managing Member, QTS Capital Mana...
Beware of Low Frequency Data by Ernie Chan, Managing Member, QTS Capital Mana...Quantopian
╠²
The document discusses the importance of data integrity in backtesting trading strategies, highlighting that poor data can lead to inflated backtest performance. It provides examples of trading strategies, including mean reversion and intraday momentum, underscoring the difference in performance outcomes when using various price data sources. The conclusion stresses that the type of historical data required depends on both execution price determination and trading signal triggering.Time series.ppt
Time series.pptALEXANDEROPOKU1
╠²
This document provides an overview of time series analysis and properties of time series data. It discusses key concepts such as:
- Time series data consisting of successive observations made over time at regular intervals.
- Examples of time series include stock prices, interest rates, GDP, and other economic indicators measured over time.
- Properties of time series data including non-stationarity, autocorrelation, and seasonal patterns.
- Components of time series including trends, seasonal variations, cyclical patterns, and irregular fluctuations.
- The importance of testing for and addressing non-stationarity through differencing or other transformations before modeling and forecasting time series data.ch05 revised ppt investment analysis and portfolio management
ch05 revised ppt investment analysis and portfolio managementRanaAlyan
╠²
Ch 5th of investment analysis and portfolio management FE3.ppt
FE3.pptasde13
╠²
Cointegration and error correction models are used to analyze the relationship between non-stationary time series variables. The Dickey-Fuller test determines if variables contain a unit root and are non-stationary. If two non-stationary variables have a stationary linear combination, they are cointegrated, indicating a long-run equilibrium relationship. An error correction model represents the short-run dynamic adjustment between cointegrated variables back to their long-run equilibrium when shocked.Time series analysis
Time series analysisUtkarsh Sharma
╠²
The document provides an overview of time series analysis. It discusses key concepts like components of a time series, stationarity, autocorrelation functions, and various forecasting models including AR, MA, ARMA, and ARIMA. It also covers exponential smoothing and how to decompose, validate, and test the accuracy of forecasting models. Examples are given of different time series patterns and how to make non-stationary data stationary.Warehouse Storage Policy Simulation
Warehouse Storage Policy SimulationSv Jayakhanthan
╠²
The document discusses a simulation-based study on storage policies in unit load warehouses, focusing on the allocation of storage locations for different SKUs to optimize operational efficiency. It analyzes the impact of various storage strategies, including dedicated, randomized, and class-based storage, on travel distances and picking times over a year-long simulation. Key findings indicate that class-based storage policies significantly reduce travel distance and time compared to random storage, especially in specific layout configurations.Factor Structure in Equity Options
Factor Structure in Equity OptionsPeter Christoffersen
╠²
1) The document presents a factor model for equity option pricing where the underlying stock price follows a factor structure linked to a stochastic volatility index.
2) Principal component analysis of implied volatility surfaces finds a strong common factor structure across equity options.
3) The model is estimated using a large dataset of equity and index option prices and is found to fit the cross-sectional variation in implied volatility surfaces across moneyness and maturity reasonably well.
4) The model implies that an equity's beta should be related to the level, skew, and term structure of its implied volatility, which is confirmed empirically.Final Time series analysis part 2. pptx
Final Time series analysis part 2. pptxSHUBHAMMBA3
╠²
The document discusses key concepts in time series analysis including stationarity, trend, seasonality, autocorrelation, and partial autocorrelation. It defines stationarity as a time series having constant mean and variance, and that it is important for analysis and accurate predictions. Trend refers to the general tendency of data to increase or decrease over a long period. Seasonality describes regular, predictable changes that occur each calendar year. Autocorrelation measures the correlation between values of a time series at different points in time, while partial autocorrelation measures the direct correlation between two time points excluding intermediate values.Variational AutoEncoders for Dimensionality Reduction in Finance
Variational AutoEncoders for Dimensionality Reduction in FinanceHumberto Ribeiro de Souza
╠²
This document discusses the application of variational autoencoders (VAEs) for dimensionality reduction of financial time series to identify similar stocks across different markets. It outlines the data preparation process, including alignment of time series and the use of geometric moving averages, as well as the VAE training process using simulated data. The results suggest that VAEs can enhance index creation from single or multi-market datasets, potentially improving stock research efficiency.PPT_Sanjeev
PPT_SanjeevSanjeev Pudasaini, MS Industrial Engg.
╠²
This document discusses predicting stock prices over the short term using vector autoregressive (VAR) and vector autoregressive moving average (VARMA) models. It first describes acquiring and preprocessing stock price data from Kaggle to make it suitable for these time series models. It then explains formulating the prediction problem in MATLAB and using tools to estimate VAR and VARMA model parameters. Results show that while neither model reaches benchmarks, VARMA(10,4) slightly outperforms VAR(4) with a mean absolute error of 0.27 for one-day-ahead forecasts. The document concludes more work is needed to improve short-term prediction, such as incorporating additional features.VaR analysis for Mutual funds
VaR analysis for Mutual fundsSiddharth Chakravarty
╠²
The document analyzes mutual fund performance through various risk assessment measures, including the Morningstar rating system and Value at Risk (VaR). It discusses different methodologies for calculating VaR, such as historical simulation and extreme value theory (EVT), while highlighting the importance of risk management in investment portfolios. The conclusion emphasizes the utility of VaR for measuring market risk but notes its limitations, particularly in predicting extreme events.More Related Content
Similar to Math 5076 Project 2 (20)
Dummy variables
Dummy variablesdineshsahejpal
╠²
This document discusses the use of dummy variables in financial econometrics. Dummy variables can be used to correct for non-normality in the error term, which is often caused by outliers in financial data. An impulse dummy variable that takes the value of 1 for the outlier observation can force the residual to 0. Dummy variables can also model qualitative effects, seasonal effects, and changes in the intercept or slope of the regression line over time. The Bera-Jarque test is used to test whether the error term is normally distributed.Dummy variables - title
Dummy variables - titleMehul Mohan
╠²
This document discusses the use of dummy variables in financial econometrics. Dummy variables can be used to correct for non-normality in data by accounting for outliers. They can also model qualitative effects by taking values of 0 or 1. The document examines intercept dummy variables, which control for changes in the intercept, and slope dummy variables, which control for changes in the slope of the regression line. Dummy variables are a useful tool for testing for structural breaks in data.Dummy variables xd
Dummy variables xdteachersdotcom
╠²
The document discusses the use of dummy variables in financial econometrics, highlighting their role in addressing issues of normality in regression models through techniques such as the Bera-Jarque test. It explains the implications of incorporating dummy variables for outliers and differentiates between different types of dummy variables, including intercept and slope dummies. Additionally, it examines the testing for structural stability using dummy variables to understand changes in regression relationships over time.Dummy variables (1)
Dummy variables (1)dinesh sharma
╠²
This document discusses the use of dummy variables in financial econometrics. Dummy variables can be used to correct for non-normality in data by accounting for outliers. They can also model qualitative effects by taking values of 0 or 1. The document examines intercept dummy variables, which control for changes in the intercept, and slope dummy variables, which control for changes in the slope of the regression line. Dummy variables are a useful tool for testing for structural breaks and stability in time series regressions.Case study of s&p 500
Case study of s&p 500Professional Training Academy
╠²
This document summarizes a case study analyzing rules for mining data from the S&P 500 stock market index. It discusses potential biases in backtesting rules to select superior performers and statistical methods to minimize these biases. Specific topics covered include data mining biases, techniques to avoid data snooping bias by splitting samples, defining the case study statistically, transforming data series into market positions with rules, constructing technical analysis indicators from price and volume data, and categories of rules examined including trends, extremes/transitions, and divergence.Cmt learning objective 36 case study of s&p 500
Cmt learning objective 36 case study of s&p 500Professional Training Academy
╠²
This document discusses a case study that analyzed over 6,400 rules for trading the S&P 500 using data mining techniques. It describes how data mining bias can lead to overstating a rule's expected future performance. The case study used statistical inference tests like White's reality check and Masters' Monte-Carlo permutation method to minimize this bias. It details the various rule types analyzed, including trends, extremes/transitions, and divergence. Input data series included raw time series, indicators, and other preprocessed data. The goal was to identify rules with genuine predictive power and evaluate their statistical and practical significance.Time Series Analysis.pptx
Time Series Analysis.pptxSunny429247
╠²
Time series data are observations collected over time on one or more variables. Time series data can be used to analyze problems involving changes over time, such as stock prices, GDP, and exchange rates. Time series data must be stationary, meaning that its statistical properties like mean and variance do not change over time, to avoid spurious regressions. Non-stationary time series can be transformed to become stationary through differencing, removing trends, or taking logs. Common time series models like ARIMA rely on stationary data.Time series and panel data in econometrics
Time series and panel data in econometricsTorajInteaash2
╠²
This document discusses various time series and panel data techniques used in econometrics. It defines secondary data and describes classifications of time series analysis including linear time series models such as linear regression, simultaneous equation models, vector autoregressive (VAR) models, and univariate time series models like autoregressive (AR), moving average (MA), and autoregressive integrated moving average (ARIMA) models. It also discusses panel data analysis techniques including panel regression models, fixed and random effects models, and tests for unit roots, cointegration, and stationarity.Beware of Low Frequency Data by Ernie Chan, Managing Member, QTS Capital Mana...
Beware of Low Frequency Data by Ernie Chan, Managing Member, QTS Capital Mana...Quantopian
╠²
The document discusses the importance of data integrity in backtesting trading strategies, highlighting that poor data can lead to inflated backtest performance. It provides examples of trading strategies, including mean reversion and intraday momentum, underscoring the difference in performance outcomes when using various price data sources. The conclusion stresses that the type of historical data required depends on both execution price determination and trading signal triggering.Time series.ppt
Time series.pptALEXANDEROPOKU1
╠²
This document provides an overview of time series analysis and properties of time series data. It discusses key concepts such as:
- Time series data consisting of successive observations made over time at regular intervals.
- Examples of time series include stock prices, interest rates, GDP, and other economic indicators measured over time.
- Properties of time series data including non-stationarity, autocorrelation, and seasonal patterns.
- Components of time series including trends, seasonal variations, cyclical patterns, and irregular fluctuations.
- The importance of testing for and addressing non-stationarity through differencing or other transformations before modeling and forecasting time series data.ch05 revised ppt investment analysis and portfolio management
ch05 revised ppt investment analysis and portfolio managementRanaAlyan
╠²
Ch 5th of investment analysis and portfolio management FE3.ppt
FE3.pptasde13
╠²
Cointegration and error correction models are used to analyze the relationship between non-stationary time series variables. The Dickey-Fuller test determines if variables contain a unit root and are non-stationary. If two non-stationary variables have a stationary linear combination, they are cointegrated, indicating a long-run equilibrium relationship. An error correction model represents the short-run dynamic adjustment between cointegrated variables back to their long-run equilibrium when shocked.Time series analysis
Time series analysisUtkarsh Sharma
╠²
The document provides an overview of time series analysis. It discusses key concepts like components of a time series, stationarity, autocorrelation functions, and various forecasting models including AR, MA, ARMA, and ARIMA. It also covers exponential smoothing and how to decompose, validate, and test the accuracy of forecasting models. Examples are given of different time series patterns and how to make non-stationary data stationary.Warehouse Storage Policy Simulation
Warehouse Storage Policy SimulationSv Jayakhanthan
╠²
The document discusses a simulation-based study on storage policies in unit load warehouses, focusing on the allocation of storage locations for different SKUs to optimize operational efficiency. It analyzes the impact of various storage strategies, including dedicated, randomized, and class-based storage, on travel distances and picking times over a year-long simulation. Key findings indicate that class-based storage policies significantly reduce travel distance and time compared to random storage, especially in specific layout configurations.Factor Structure in Equity Options
Factor Structure in Equity OptionsPeter Christoffersen
╠²
1) The document presents a factor model for equity option pricing where the underlying stock price follows a factor structure linked to a stochastic volatility index.
2) Principal component analysis of implied volatility surfaces finds a strong common factor structure across equity options.
3) The model is estimated using a large dataset of equity and index option prices and is found to fit the cross-sectional variation in implied volatility surfaces across moneyness and maturity reasonably well.
4) The model implies that an equity's beta should be related to the level, skew, and term structure of its implied volatility, which is confirmed empirically.Final Time series analysis part 2. pptx
Final Time series analysis part 2. pptxSHUBHAMMBA3
╠²
The document discusses key concepts in time series analysis including stationarity, trend, seasonality, autocorrelation, and partial autocorrelation. It defines stationarity as a time series having constant mean and variance, and that it is important for analysis and accurate predictions. Trend refers to the general tendency of data to increase or decrease over a long period. Seasonality describes regular, predictable changes that occur each calendar year. Autocorrelation measures the correlation between values of a time series at different points in time, while partial autocorrelation measures the direct correlation between two time points excluding intermediate values.Variational AutoEncoders for Dimensionality Reduction in Finance
Variational AutoEncoders for Dimensionality Reduction in FinanceHumberto Ribeiro de Souza
╠²
This document discusses the application of variational autoencoders (VAEs) for dimensionality reduction of financial time series to identify similar stocks across different markets. It outlines the data preparation process, including alignment of time series and the use of geometric moving averages, as well as the VAE training process using simulated data. The results suggest that VAEs can enhance index creation from single or multi-market datasets, potentially improving stock research efficiency.PPT_Sanjeev
PPT_SanjeevSanjeev Pudasaini, MS Industrial Engg.
╠²
This document discusses predicting stock prices over the short term using vector autoregressive (VAR) and vector autoregressive moving average (VARMA) models. It first describes acquiring and preprocessing stock price data from Kaggle to make it suitable for these time series models. It then explains formulating the prediction problem in MATLAB and using tools to estimate VAR and VARMA model parameters. Results show that while neither model reaches benchmarks, VARMA(10,4) slightly outperforms VAR(4) with a mean absolute error of 0.27 for one-day-ahead forecasts. The document concludes more work is needed to improve short-term prediction, such as incorporating additional features.VaR analysis for Mutual funds
VaR analysis for Mutual fundsSiddharth Chakravarty
╠²
The document analyzes mutual fund performance through various risk assessment measures, including the Morningstar rating system and Value at Risk (VaR). It discusses different methodologies for calculating VaR, such as historical simulation and extreme value theory (EVT), while highlighting the importance of risk management in investment portfolios. The conclusion emphasizes the utility of VaR for measuring market risk but notes its limitations, particularly in predicting extreme events.Math 5076 Project 2
- 1. Time Series Volatility Models -Different volatility estimation by Equal Weight Model & EWMA & GARCH(1,1) -By Di Wu & Zheng Rong
- 2. Agenda: ÔÇó Equal Weight model ÔÇó EWMA ÔÇó GARCH(1,1)
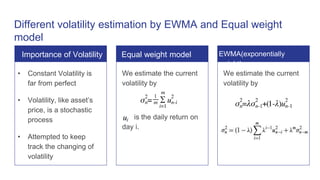
- 3. Different volatility estimation by EWMA and Equal weight model We estimate the current volatility by is the daily return on day i. We estimate the current volatility by ÔÇó Constant Volatility is far from perfect ÔÇó Volatility, like assetÔÇÖs price, is a stochastic process ÔÇó Attempted to keep track the changing of volatility Equal weight modelImportance of Volatility EWMA(exponentially weight)
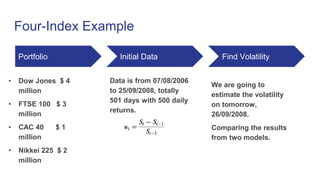
- 4. Four-Index Example Portfolio ÔÇó Dow Jones $ 4 million ÔÇó FTSE 100 $ 3 million ÔÇó CAC 40 $ 1 million ÔÇó Nikkei 225 $ 2 million Initial Data Data is from 07/08/2006 to 25/09/2008, totally 501 days with 500 daily returns. Find Volatility We are going to estimate the volatility on tomorrow, 26/09/2008. Comparing the results from two models.
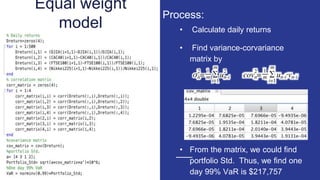
- 5. Equal weight model ÔÇó Calculate daily returns ÔÇó Find variance-corvariance matrix by ÔÇó From the matrix, we could find portfolio Std. Thus, we find one day 99% VaR is $217,757 Process:
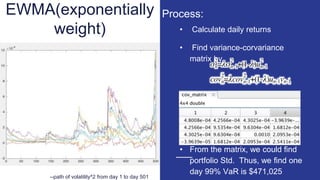
- 6. EWMA(exponentially weight) ÔÇó Calculate daily returns ÔÇó Find variance-corvariance matrix by ÔÇó From the matrix, we could find portfolio Std. Thus, we find one day 99% VaR is $471,025 Process: --path of volatility^2 from day 1 to day 501
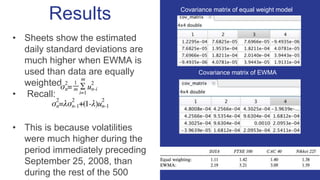
- 7. Results ÔÇó Sheets show the estimated daily standard deviations are much higher when EWMA is used than data are equally weighted. ÔÇó Recall: ÔÇó This is because volatilities were much higher during the period immediately preceding September 25, 2008, than during the rest of the 500 Covariance matrix of equal weight model Covariance matrix of EWMA
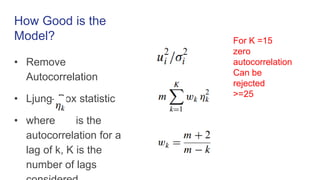
- 10. How Good is the Model? ÔÇó Remove Autocorrelation ÔÇó LjungÔÇôBox statistic ÔÇó where is the autocorrelation for a lag of k, K is the number of lags For K =15 zero autocorrelation Can be rejected >=25
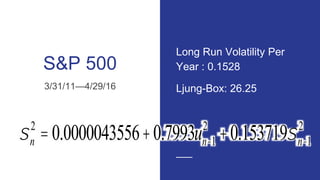
- 11. S&P 500 3/31/11ÔÇö4/29/16 sn 2 =0.0000043556+0.7993un-1 2 +0.153719sn-1 2 Long Run Volatility Per Year : 0.1528 Ljung-Box: 26.25
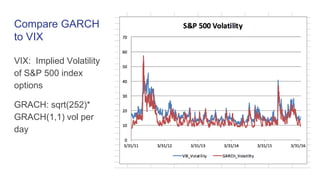
- 12. Compare GARCH to VIX VIX: Implied Volatility of S&P 500 index options GRACH: sqrt(252)* GRACH(1,1) vol per day
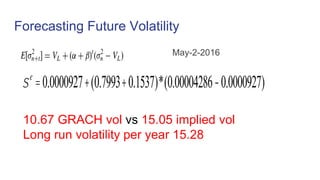
- 13. Forecasting Future Volatility May-2-2016 se =0.0000927+(0.7993+0.1537)*(0.00004286-0.0000927) 10.67 GRACH vol vs 15.05 implied vol Long run volatility per year 15.28
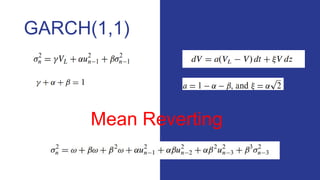
- 14. Summary ÔÇó The key feature of the EWMA is that it does not give equal weight to the observations on the ui^2 . ÔÇó The more recent an observation, the greater the weight assigned to it. ÔÇó GARCH(1,1) incorporates mean reversion ------theoretically more appealing Which model is better?
- 15. Thank you
Editor's Notes
- #9: The parameter belta can be interpreted as a ÔÇÿÔÇÿdecay rateÔÇÖÔÇÖ. It is similar to in the EWMA model. But the GARCH(1,1) assigs weights that decline exponentially to past u^2, it also assigns some weight to the long-run average volatility. The GARCH (1,1) model recognizes that over time the variance tends to get pulled back to a long-run average level of VL. In practice, variance rates do tend to be mean reverting. The GARCH(1,1) model incorporates mean reversion, whereas the EWMA model does not. GARCH (1,1) is therefore theoretically more appealing than the EWMA model.
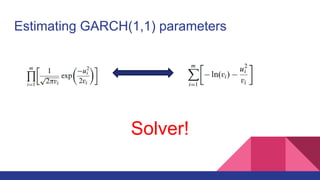
- #10: We are interested in choosing omega, alpha, and belta to maximize the sum of the numbers in the sixth column. This involves an iterative search procedure. Occasionally Solver gives a local maximum, so testing a number of different starting values for parameters is a good idea.
- #11: Informally, it is the similarity between observations as a function of the time lag. considering the autocorrelation structure for the variables u_i^2 / sigma_i^2 Autocorrelation of the errors violates the ordinary least squares (OLS) assumption that the error terms are uncorrelated, meaning that the╠²Gauss Markov theorem╠²does not apply, and that OLS estimators are no longer the Best Linear Unbiased Estimators (BLUE). DurbinÔÇôWatson statistic