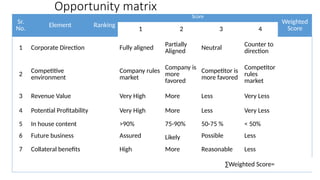
1. Opportunity matrix
Sr.
No. Element Ranking
Score
Weighted
Score
1 2 3 4
1 Corporate Direction Fully aligned Partially
Aligned
Neutral Counter to
direction
2
Competitive
environment
Company rules
market
Company is
more
favored
Competitor is
more favored
Competitor
rules
market
3 Revenue Value Very High More Less Very Less
4 Potential Profitability Very High More Less Very Less
5 In house content >90% 75-90% 50-75 % < 50%
6 Future business Assured Likely Possible Less
7 Collateral benefits High More Reasonable Less
‚àëWeighted Score=
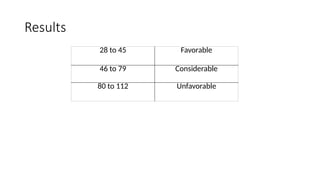
2. Results
28 to 45 Favorable
46 to 79 Considerable
80 to 112 Unfavorable
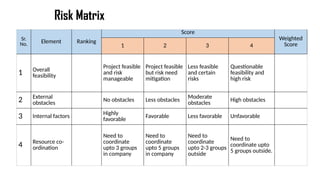
3. Risk Matrix
Sr.
No. Element Ranking
Score
Weighted
Score
1 2 3 4
1 Overall
feasibility
Project feasible
and risk
manageable
Project feasible
but risk need
mitigation
Less feasible
and certain
risks
Questionable
feasibility and
high risk
2 External
obstacles
No obstacles Less obstacles
Moderate
obstacles
High obstacles
3 Internal factors Highly
favorable
Favorable Less favorable Unfavorable
4 Resource co-
ordination
Need to
coordinate
upto 3 groups
in company
Need to
coordinate
upto 5 groups
in company
Need to
coordinate
upto 2-3 groups
outside
Need to
coordinate upto
5 groups outside.
4. Sr.
No. Element Ranking
Score
Weighted
Score
1 2 3 4
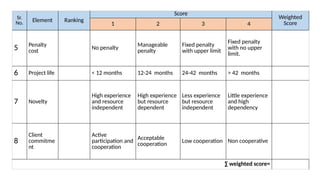
5 Penalty
cost
No penalty
Manageable
penalty
Fixed penalty
with upper limit
Fixed penalty
with no upper
limit.
6 Project life < 12 months 12-24 months 24-42 months > 42 months
7 Novelty
High experience
and resource
independent
High experience
but resource
dependent
Less experience
but resource
independent
Little experience
and high
dependency
8
Client
commitme
nt
Active
participation and
cooperation
Acceptable
cooperation
Low cooperation Non cooperative
‚àë weighted score=
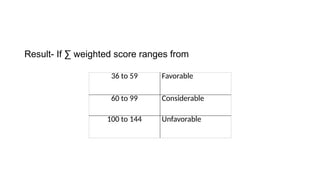
5. Result- If ‚àë weighted score ranges from
36 to 59 Favorable
60 to 99 Considerable
100 to 144 Unfavorable
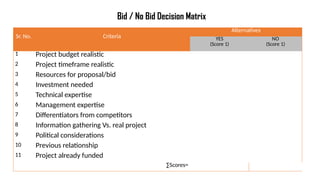
6. Sr. No. Criteria
Alternatives
YES
(Score 1)
NO
(Score 1)
1 Project budget realistic
2 Project timeframe realistic
3 Resources for proposal/bid
4 Investment needed
5 Technical expertise
6 Management expertise
7 Differentiators from competitors
8 Information gathering Vs. real project
9 Political considerations
10 Previous relationship
11 Project already funded
‚àëScores=
Bid / No Bid Decision Matrix
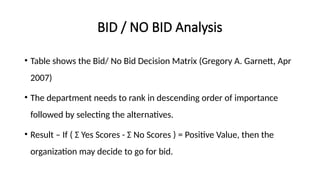
7. BID / NO BID Analysis
• Table shows the Bid/ No Bid Decision Matrix (Gregory A. Garnett, Apr
2007)
• The department needs to rank in descending order of importance
followed by selecting the alternatives.
• Result – If ( Σ Yes Scores - Σ No Scores ) = Positive Value, then the
organization may decide to go for bid.