Measures of-central-tendency-dispersion
Download as ppt, pdf0 likes187 views

This document discusses measures of central tendency (mean, median, mode) and measures of dispersion (range, standard deviation). It explains how to calculate each measure and their strengths and weaknesses. For example, the mean is more sensitive than the median but can be skewed by outliers, while the median is not affected by outliers but is less sensitive. The document also provides examples of calculating and interpreting the mean, range, and standard deviation using sample data.
Measures of-central-tendency-dispersion
- 1. Measures of central tendency and dispersion
- 2. Measures of central tendency ŌĆó Mean ŌĆó Median ŌĆó Mode ŌĆó ie finding a ŌĆśtypicalŌĆÖ value from the middle of the data.
- 3. You need to be able to: ŌĆó Explain how to calculate the mean, median and mode ŌĆó State the strengths and weaknesses of mean, median and mode ŌĆó This could include saying which one you would use for some data e.g. 2, 2, 3, 2, 3, 2, 3, 2, 97 - would you use mean or median here?
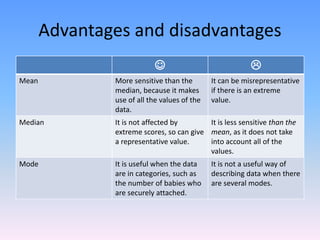
- 4. Advantages and disadvantages ’üŖ ’üī Mean More sensitive than the median, because it makes use of all the values of the data. It can be misrepresentative if there is an extreme value. Median It is not affected by extreme scores, so can give a representative value. It is less sensitive than the mean, as it does not take into account all of the values. Mode It is useful when the data are in categories, such as the number of babies who are securely attached. It is not a useful way of describing data when there are several modes.
- 5. Measures of Dispersion ŌĆó Measures of ŌĆśspreadŌĆÖ ŌĆó This looks at how ŌĆśspread outŌĆÖ the data are. ŌĆó Are the scores similar to each other (closely clustered), or quite spread out?
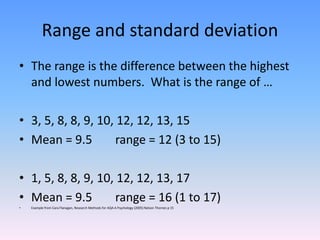
- 6. Range and standard deviation ŌĆó The range is the difference between the highest and lowest numbers. What is the range of ŌĆ” ŌĆó 3, 5, 8, 8, 9, 10, 12, 12, 13, 15 ŌĆó Mean = 9.5 range = 12 (3 to 15) ŌĆó 1, 5, 8, 8, 9, 10, 12, 12, 13, 17 ŌĆó Mean = 9.5 range = 16 (1 to 17) ŌĆó Example from Cara Flanagan, Research Methods for AQA A Psychology (2005) Nelson Thornes p 15
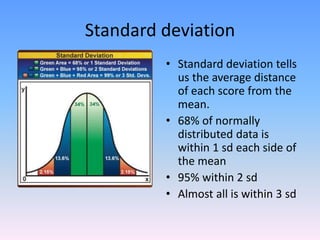
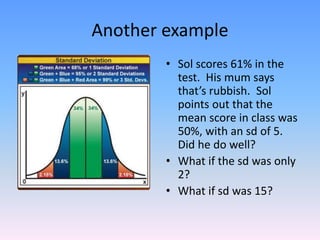
- 7. Standard deviation ŌĆó Standard deviation tells us the average distance of each score from the mean. ŌĆó 68% of normally distributed data is within 1 sd each side of the mean ŌĆó 95% within 2 sd ŌĆó Almost all is within 3 sd
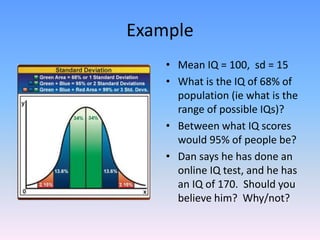
- 8. Example ŌĆó Mean IQ = 100, sd = 15 ŌĆó What is the IQ of 68% of population (ie what is the range of possible IQs)? ŌĆó Between what IQ scores would 95% of people be? ŌĆó Dan says he has done an online IQ test, and he has an IQ of 170. Should you believe him? Why/not?
- 9. Another example ŌĆó Sol scores 61% in the test. His mum says thatŌĆÖs rubbish. Sol points out that the mean score in class was 50%, with an sd of 5. Did he do well? ŌĆó What if the sd was only 2? ŌĆó What if sd was 15?
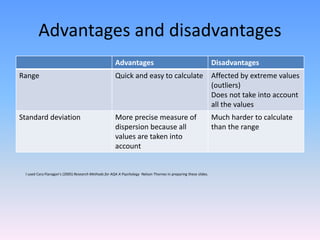
- 10. Advantages and disadvantages Advantages Disadvantages Range Quick and easy to calculate Affected by extreme values (outliers) Does not take into account all the values Standard deviation More precise measure of dispersion because all values are taken into account Much harder to calculate than the range I used Cara FlanaganŌĆÖs (2005) Research Methods for AQA A Psychology Nelson Thornes in preparing these slides.