Medication Delivery Turnaround Time
5 likes1,143 views
The document outlines a study on improving medication delivery turnaround time for newly admitted patients at Zulekha Hospital using Six Sigma methodology. It details the DMAIC phasesŌĆödefine, measure, analyze, improve, controlŌĆöand highlights the use of statistical analysis to identify root causes of delays in medication dispensation. The project aims to enhance efficiency, reduce patient waiting times, and ultimately improve customer satisfaction in healthcare delivery.
1 of 24


Ad
Recommended
Lean Six Sigma
Lean Six SigmaShankaran Rd
╠²
This document provides an overview of Lean Six Sigma in 3 phases:
1) Pre-Define phase explains that Six Sigma helps improve quality and customer satisfaction while reducing costs, and Lean helps eliminate waste and improve efficiencies. Lean should be applied before Six Sigma to reduce waste before improving efficiency.
2) Define phase involves understanding customer wants, translating them into measurable requirements, identifying critical needs, and defining the project charter.
3) Measure phase focuses on validating measurement systems, collecting baseline data, understanding input variables, analyzing process stability, and calculating process capability.Troubleshooting QC Problems: Your QC has failed, what do you do next?
Troubleshooting QC Problems: Your QC has failed, what do you do next?Randox
╠²
The document outlines essential steps for troubleshooting quality control (QC) errors in laboratory settings, emphasizing the need for standard operating procedures to effectively manage out-of-control events. It details the importance of analyzing Levey-Jennings charts to identify types of errors, implementing corrective actions based on identified causes, and documenting the outcomes to prevent future errors. Additionally, it recommends using QC multi-rules for sensitive error detection and highlights continuous monitoring practices to maintain laboratory performance.Basic Qulaity Tools/Techniques Workshop for process improvement
Basic Qulaity Tools/Techniques Workshop for process improvementMouad Hourani
╠²
The document outlines basic quality tools for process improvement, detailing various techniques such as brainstorming, affinity diagrams, flowcharts, and fishbone diagrams, as well as their appropriate applications and procedures. It emphasizes the importance of using these tools to identify problems, engage teams in creative solutions, and systematically analyze data for performance enhancement. Additionally, it includes guidelines for implementing quality improvement projects within a healthcare setting.Quality Clinic Do-It-Yourself Kit - sample
Quality Clinic Do-It-Yourself Kit - sampleMark H. Davis
╠²
The document outlines a do-it-yourself kit for foundational Lean Six Sigma training, aimed at teaching essential concepts and providing tools to improve business performance. It emphasizes the importance of understanding processes, measuring quality from the customer's perspective, and using data-driven methodologies to reduce waste, defects, and cycle time. The training includes various frameworks for problem-solving and aims to inform, equip, and empower individuals to enhance organizational effectiveness.Troubleshooting IQC / EQAS
Troubleshooting IQC / EQASDr. Bikash Kumar Chaudhury
╠²
This document discusses quality control, quality assurance, and quality assessment in medical laboratories. It defines key terms like quality control, quality assurance, and quality assessment. Quality control refers to analytical measurements used to assess data quality, while quality assurance is an overall management plan to ensure data integrity. Quality assessment determines the quality of results generated by evaluating internal and external quality programs. The document outlines quality assurance and quality control processes like standard operating procedures, equipment and reagent validation, personnel competency, and documentation. It also discusses error types, control chart interpretation, and Westgard rules for evaluating quality control results.Applying Lean Six Sigma in Healthcare
Applying Lean Six Sigma in HealthcareInternational Institute for Learning
╠²
This webinar organized by IIL focuses on applying Lean Six Sigma principles to improve quality in healthcare processes. Participants will learn about defining quality, identifying opportunities for improvement, and understanding the DMAIC framework for addressing clinical errors. The seminar emphasizes that improving healthcare systems requires a cultural shift and error-proofing measures rather than simply blaming individuals for mistakes.Troubleshooting iqc eqas 19.07.2018
Troubleshooting iqc eqas 19.07.2018Dr. Bikash Kumar Chaudhury
╠²
The document discusses quality control, quality assurance, and quality assessment in medical laboratories. It defines key terms like quality control, quality assurance, and quality assessment. Quality control refers to internal processes like controls to ensure tests are working properly. Quality assurance refers to the overall program to ensure correct results are reported. Quality assessment involves external challenges to evaluate the laboratory's programs. The document outlines quality assurance cycles and compares quality control and quality assurance. It also discusses corrective actions and root cause analysis for external quality assessment troubleshooting.Quality assignment(1)
Quality assignment(1)Reham Mokhtar
╠²
This document discusses quality control in clinical laboratories. It outlines objectives related to establishing analytical goals, quality control schemes, and identifying quality control charts and roles. It describes using control charts like Levey-Jennings charts to monitor quality control data over time and evaluate if tests are in or out of control. It also discusses Westgard rules, a multi-rule quality control procedure used to determine if an analytical run is in or out of statistical control.4 Of The 7 Problem Solving Tools
4 Of The 7 Problem Solving Toolsagustini Nyotorahardjo
╠²
The document discusses 4 of the 7 problem solving tools: Cause and Effect Diagrams, Flowcharts, Checklists, and Pareto Analysis. It provides descriptions of what each tool is, why it is used, and an example for each. Cause and Effect Diagrams help identify primary and secondary causes of a problem. Flowcharts visualize processes to detect bottlenecks. Checklists ensure standards are followed. Pareto Analysis identifies the "vital few" key causes that produce most problems.Basic QC Statistics - Improving Laboratory Performance Through Quality Contro...
Basic QC Statistics - Improving Laboratory Performance Through Quality Contro...Randox
╠²
The document outlines the importance of quality control (QC) in laboratory settings, emphasizing that accurate laboratory tests are crucial for patient diagnosis and treatment decisions. It describes two forms of QC: Internal Quality Control (IQC), which monitors daily lab performance, and External Quality Assessment (EQA), which compares lab results against others to ensure accuracy. The document also discusses statistical measures such as mean, standard deviation, and coefficient of variation used in assessing laboratory performance and outlines procedures for maintaining robust QC systems to prevent misdiagnosis and unnecessary expenses.Lean in histopathology
Lean in histopathologyterrycoaker
╠²
The document discusses the lean transformation of cellular pathology at the Royal Victoria Infirmary, highlighting significant changes made between 1981 and 2014 to improve efficiency and service quality. It emphasizes the use of lean thinking, various tools to facilitate continuous improvement, and the importance of engaging staff in the transformation process to minimize resistance. Key drivers for change are outlined, alongside strategies such as process optimization and effective communication to promote operational excellence in histology services.Understanding statistics in laboratory quality control
Understanding statistics in laboratory quality controlRandox
╠²
This document discusses laboratory quality control and interpreting quality control results. It outlines a 5 step process: 1) Calculate the mean, 2) Calculate the standard deviation, 3) Establish decision limits, 4) Create a Levey-Jennings chart, and 5) Accept or reject results based on quality control rules. Statistics like the mean, standard deviation, and decision limits are used to monitor the accuracy and precision of analytical testing and ensure reliable patient results. Quality control software can automate the calculation of these statistics and generation of charts to more easily monitor performance.Lean concepts and quality indicators final
Lean concepts and quality indicators finalDr. Bikash Kumar Chaudhury
╠²
This document provides an overview of Lean Management. It discusses key Lean concepts like the eight wastes (Muda, Mura, Muri), 5S methodology, visual management, and standardized work. The building blocks of Lean Management aim to eliminate waste and create continuous process improvement. Quality indicators are established to monitor performance across examination processes and ensure objectives are met. Lean Thinking focuses on delivering value to the customer with the least amount of wasted resources.How to Measure Uncertainty
How to Measure UncertaintyRandox
╠²
The document outlines the importance of measuring measurement uncertainty in laboratory testing, specifying the need for each laboratory to define and regularly review the performance requirements related to measurement uncertainty. It describes the two main types of precision, intra assay and inter assay, and provides formulas for calculating uncertainty, emphasizing the significance of bias and sources of uncertainty. Additionally, it discusses quality control processes and the use of data to ensure the reliability and accuracy of measurements in a clinical environment.Designing an appropriate QC procedure for your laboratory
Designing an appropriate QC procedure for your laboratoryRandox
╠²
The document outlines the importance of implementing effective quality control (QC) procedures in laboratories to ensure accurate and reliable test results. It details five essential steps for QC success, including identifying quality specifications for tests, selecting high-quality control materials, and employing robust evaluation methods to recognize and address out-of-control events. Adhering to these practices is crucial for patient safety and helps laboratories maintain high standards in medical testing.Structured Problem Solving (Correction, Corrective Action, Preventive Action ...
Structured Problem Solving (Correction, Corrective Action, Preventive Action ...Lallu Joseph
╠²
The document discusses structured problem solving in quality management, focusing on correction, corrective actions (CA), and preventive actions (PA). It outlines various problem-solving techniques, such as root cause analysis and the PDCA cycle, emphasizing the importance of identifying root causes and implementing proactive measures to prevent non-conformities. Additionally, it highlights the evolution of ISO 9001 standards and the significance of continual improvement in quality management systems.Internal quality control
Internal quality controlSyed Basheer
╠²
The document discusses the procedures and metrics involved in quality control within medical laboratories, emphasizing the importance of monitoring analytical processes to avoid reporting incorrect patient results. It defines key terms such as accuracy, precision, bias, and various error types, while also detailing how to compute and interpret statistical measures like mean, standard deviation, and coefficient of variation. Additionally, it outlines specific Westgard rules that assist in identifying systematic and random errors in quality control data.Leanlondon 19sep13
Leanlondon 19sep13Kinetik Solutions Ltd
╠²
The document summarizes lean process improvements implemented in a histopathology department. Broad aims included sharing lean solutions, debating strengths/weaknesses, and networking. Specific changes included:
1) Mapping processes to identify waste like movement and waiting, then standardizing work like using templates to reduce movement and errors.
2) Optimizing the laboratory layout to reduce distance traveled and support continuous specimen flow.
3) Introducing a "pull" system where consultants pull batches based on capacity rather than being "pushed" work, improving turnaround times.
These changes reduced non-value added time and waste, supporting the goals of faster reporting and improved patient care.Using QC Multi-rules
Using QC Multi-rulesRandox
╠²
The document outlines a set of QC multi-rules used to minimize false rejections and ensure high error detection rates in laboratory testing. It describes various rules for evaluating control results, including rules for identifying random and systematic errors, and emphasizes the importance of maintenance and calibration. Additionally, it highlights the capabilities of Randox's quality control system and the need for careful analysis of QC data.Haemoglobin quality control by maintaining levey jennings chart
Haemoglobin quality control by maintaining levey jennings chartDr Rashmi Sood
╠²
Haemoglobin quality control is important for blood donor selection and ensuring donor safety. The document discusses maintaining Levey Jennings charts to monitor internal quality control of haemoglobin measurements using a Hemocue analyzer. Westgard rules are applied to the charts to detect random errors like those caused by new staff and systematic errors indicating issues like reagent problems. Maintaining quality control through daily, weekly and monthly checks helps assure accurate haemoglobin results.Improving Laboratory Performance Through Quality Control - The role of EQA in...
Improving Laboratory Performance Through Quality Control - The role of EQA in...Randox
╠²
The document discusses the importance of quality control (QC) in laboratories, emphasizing the role of external quality assessment (EQA) in ensuring the accuracy and precision of test results. It highlights that while internal quality control (IQC) is essential, it does not provide a complete quality management solution, particularly in detecting bias and accuracy errors, which EQA can address. Laboratories are encouraged to participate in accredited EQA schemes to enhance their testing standards and ensure reliable patient outcomes.Troubleshooting Poor EQA/QC Performance in the Laboratory
Troubleshooting Poor EQA/QC Performance in the Laboratory Randox
╠²
The document outlines a systematic approach for investigating and addressing poor performance in external quality assessment (EQA) programs, highlighting the three main steps: investigating the source of the problem, implementing corrective actions, and checking the effectiveness of those actions. It categorizes analytical errors into clerical, systematic, and random errors, providing guidance on identifying common causes and necessary corrective actions. Additionally, it emphasizes the importance of monitoring performance over time to assess the impact of corrective measures.EQA: An Essential Tool for Laboratory Quality - Africa LT649
EQA: An Essential Tool for Laboratory Quality - Africa LT649 Randox
╠²
External quality assessment (EQA) is crucial for ensuring laboratory accuracy and reliability, as 75% of diagnoses rely on lab test results. EQA, alongside internal quality control (IQC), helps identify laboratory errors, improve performance, reduce repeat tests, and ultimately minimize patient risk. Real-life testimonials highlight the significant benefits of EQA in various laboratories, demonstrating its effectiveness in enhancing quality and confidence in test results.How often is Right for Laboratory Quality Control?
How often is Right for Laboratory Quality Control?Randox
╠²
Laboratories must determine the appropriate frequency for quality control (QC) based on various factors, including assay stability, volume of patient samples, and risk associated with erroneous results. Regularly asking the right questions is crucial to identify high-risk and unstable tests, ensuring QC evaluations are timely and effective. Ultimately, while daily QC may be common, frequency should be tailored to specific lab conditions and procedures to ensure accurate patient results and minimize potential harm.Corrective & Preventive Action
Corrective & Preventive Actionkiranreddy munnangi
╠²
This document discusses Corrective and Preventive Action (CAPA) processes. It defines correction, corrective action, and preventive action. Correction provides an immediate remedy but does not fix the root cause. Corrective action eliminates the cause of nonconformity to prevent recurrence. Preventive action anticipates potential problems. Examples are provided such as replacing a clogged U-trap to correct a leaky sink, and checking other sinks to prevent future issues. The CAPA process involves identifying issues, investigating root causes, developing action plans, implementing solutions, and verifying effectiveness. CAPA is important for continuously improving quality in an organization.Laboratory Internal Quality Control presentation master revision, 2014
Laboratory Internal Quality Control presentation master revision, 2014Adel Elazab Elged
╠²
This document outlines the importance of internal quality control (IQC) in clinical pathology, detailing its procedures, including daily monitoring to ensure reliable and reproducible test results. It discusses various statistical methods like Levey-Jennings charts and Westgard rules for maintaining quality, alongside troubleshooting techniques when tests are out of control. The ultimate goal is to ensure accurate laboratory testing through careful management and analysis of quality control materials.Quality control program 05042018
Quality control program 05042018Syed Basheer
╠²
This document provides an overview of quality control programs in medical laboratories. It defines key terms related to quality control such as accuracy, bias, calibration, standard deviation, and Westgard rules. The Westgard rules are statistical approaches used to detect errors in analytical testing by monitoring quality control sample measurements. The document explains concepts like standard deviation, coefficient of variation, and standard deviation index which are used to statistically analyze quality control sample results.Some illustrative examples on the analysis of the SW-CRT
Some illustrative examples on the analysis of the SW-CRTNIHR CLAHRC West Midlands
╠²
The document discusses the analysis of stepped wedge cluster randomized trials (SW-CRTs), emphasizing the confounding effect of calendar time on study results. It presents examples of two interventions, one related to maternity sweeping and another concerning critical care outreach, highlighting the need for careful modeling to adjust for temporal effects in the evaluation of treatment impacts. The importance of considering time as a covariate in analyses and the requirement for sufficient statistical power for model extensions is also underscored.Health Care Improvement By Management Tools
Health Care Improvement By Management ToolsDr.Ashok Khandelwal
╠²
The document discusses various management techniques that can be used to improve healthcare delivery and lower costs. These include PDCA (Plan-Do-Check-Act) cycle, Six Sigma, balanced scorecard, Lean methodology, business process reengineering, and benchmarking. Case studies are provided that demonstrate how these techniques were used to reduce prolonged hospital stays, delays in lab and ultrasound reports, and surgical infections.QSIR knowledge exchange - Matt Tite presentation
QSIR knowledge exchange - Matt Tite presentationNHS Improving Quality
╠²
The document outlines a quality improvement program aimed at enhancing healthcare delivery based on the five-year forward view, focusing on diagnosis and treatment for cancer and other health services. It emphasizes the importance of using statistical process control (SPC) and Pareto analysis to identify issues in healthcare quality and capacity management. Additionally, it discusses capacity and demand management in primary care, suggesting that effective planning must take into account seasonal variations and different demand patterns throughout the week.More Related Content
What's hot (20)
4 Of The 7 Problem Solving Tools
4 Of The 7 Problem Solving Toolsagustini Nyotorahardjo
╠²
The document discusses 4 of the 7 problem solving tools: Cause and Effect Diagrams, Flowcharts, Checklists, and Pareto Analysis. It provides descriptions of what each tool is, why it is used, and an example for each. Cause and Effect Diagrams help identify primary and secondary causes of a problem. Flowcharts visualize processes to detect bottlenecks. Checklists ensure standards are followed. Pareto Analysis identifies the "vital few" key causes that produce most problems.Basic QC Statistics - Improving Laboratory Performance Through Quality Contro...
Basic QC Statistics - Improving Laboratory Performance Through Quality Contro...Randox
╠²
The document outlines the importance of quality control (QC) in laboratory settings, emphasizing that accurate laboratory tests are crucial for patient diagnosis and treatment decisions. It describes two forms of QC: Internal Quality Control (IQC), which monitors daily lab performance, and External Quality Assessment (EQA), which compares lab results against others to ensure accuracy. The document also discusses statistical measures such as mean, standard deviation, and coefficient of variation used in assessing laboratory performance and outlines procedures for maintaining robust QC systems to prevent misdiagnosis and unnecessary expenses.Lean in histopathology
Lean in histopathologyterrycoaker
╠²
The document discusses the lean transformation of cellular pathology at the Royal Victoria Infirmary, highlighting significant changes made between 1981 and 2014 to improve efficiency and service quality. It emphasizes the use of lean thinking, various tools to facilitate continuous improvement, and the importance of engaging staff in the transformation process to minimize resistance. Key drivers for change are outlined, alongside strategies such as process optimization and effective communication to promote operational excellence in histology services.Understanding statistics in laboratory quality control
Understanding statistics in laboratory quality controlRandox
╠²
This document discusses laboratory quality control and interpreting quality control results. It outlines a 5 step process: 1) Calculate the mean, 2) Calculate the standard deviation, 3) Establish decision limits, 4) Create a Levey-Jennings chart, and 5) Accept or reject results based on quality control rules. Statistics like the mean, standard deviation, and decision limits are used to monitor the accuracy and precision of analytical testing and ensure reliable patient results. Quality control software can automate the calculation of these statistics and generation of charts to more easily monitor performance.Lean concepts and quality indicators final
Lean concepts and quality indicators finalDr. Bikash Kumar Chaudhury
╠²
This document provides an overview of Lean Management. It discusses key Lean concepts like the eight wastes (Muda, Mura, Muri), 5S methodology, visual management, and standardized work. The building blocks of Lean Management aim to eliminate waste and create continuous process improvement. Quality indicators are established to monitor performance across examination processes and ensure objectives are met. Lean Thinking focuses on delivering value to the customer with the least amount of wasted resources.How to Measure Uncertainty
How to Measure UncertaintyRandox
╠²
The document outlines the importance of measuring measurement uncertainty in laboratory testing, specifying the need for each laboratory to define and regularly review the performance requirements related to measurement uncertainty. It describes the two main types of precision, intra assay and inter assay, and provides formulas for calculating uncertainty, emphasizing the significance of bias and sources of uncertainty. Additionally, it discusses quality control processes and the use of data to ensure the reliability and accuracy of measurements in a clinical environment.Designing an appropriate QC procedure for your laboratory
Designing an appropriate QC procedure for your laboratoryRandox
╠²
The document outlines the importance of implementing effective quality control (QC) procedures in laboratories to ensure accurate and reliable test results. It details five essential steps for QC success, including identifying quality specifications for tests, selecting high-quality control materials, and employing robust evaluation methods to recognize and address out-of-control events. Adhering to these practices is crucial for patient safety and helps laboratories maintain high standards in medical testing.Structured Problem Solving (Correction, Corrective Action, Preventive Action ...
Structured Problem Solving (Correction, Corrective Action, Preventive Action ...Lallu Joseph
╠²
The document discusses structured problem solving in quality management, focusing on correction, corrective actions (CA), and preventive actions (PA). It outlines various problem-solving techniques, such as root cause analysis and the PDCA cycle, emphasizing the importance of identifying root causes and implementing proactive measures to prevent non-conformities. Additionally, it highlights the evolution of ISO 9001 standards and the significance of continual improvement in quality management systems.Internal quality control
Internal quality controlSyed Basheer
╠²
The document discusses the procedures and metrics involved in quality control within medical laboratories, emphasizing the importance of monitoring analytical processes to avoid reporting incorrect patient results. It defines key terms such as accuracy, precision, bias, and various error types, while also detailing how to compute and interpret statistical measures like mean, standard deviation, and coefficient of variation. Additionally, it outlines specific Westgard rules that assist in identifying systematic and random errors in quality control data.Leanlondon 19sep13
Leanlondon 19sep13Kinetik Solutions Ltd
╠²
The document summarizes lean process improvements implemented in a histopathology department. Broad aims included sharing lean solutions, debating strengths/weaknesses, and networking. Specific changes included:
1) Mapping processes to identify waste like movement and waiting, then standardizing work like using templates to reduce movement and errors.
2) Optimizing the laboratory layout to reduce distance traveled and support continuous specimen flow.
3) Introducing a "pull" system where consultants pull batches based on capacity rather than being "pushed" work, improving turnaround times.
These changes reduced non-value added time and waste, supporting the goals of faster reporting and improved patient care.Using QC Multi-rules
Using QC Multi-rulesRandox
╠²
The document outlines a set of QC multi-rules used to minimize false rejections and ensure high error detection rates in laboratory testing. It describes various rules for evaluating control results, including rules for identifying random and systematic errors, and emphasizes the importance of maintenance and calibration. Additionally, it highlights the capabilities of Randox's quality control system and the need for careful analysis of QC data.Haemoglobin quality control by maintaining levey jennings chart
Haemoglobin quality control by maintaining levey jennings chartDr Rashmi Sood
╠²
Haemoglobin quality control is important for blood donor selection and ensuring donor safety. The document discusses maintaining Levey Jennings charts to monitor internal quality control of haemoglobin measurements using a Hemocue analyzer. Westgard rules are applied to the charts to detect random errors like those caused by new staff and systematic errors indicating issues like reagent problems. Maintaining quality control through daily, weekly and monthly checks helps assure accurate haemoglobin results.Improving Laboratory Performance Through Quality Control - The role of EQA in...
Improving Laboratory Performance Through Quality Control - The role of EQA in...Randox
╠²
The document discusses the importance of quality control (QC) in laboratories, emphasizing the role of external quality assessment (EQA) in ensuring the accuracy and precision of test results. It highlights that while internal quality control (IQC) is essential, it does not provide a complete quality management solution, particularly in detecting bias and accuracy errors, which EQA can address. Laboratories are encouraged to participate in accredited EQA schemes to enhance their testing standards and ensure reliable patient outcomes.Troubleshooting Poor EQA/QC Performance in the Laboratory
Troubleshooting Poor EQA/QC Performance in the Laboratory Randox
╠²
The document outlines a systematic approach for investigating and addressing poor performance in external quality assessment (EQA) programs, highlighting the three main steps: investigating the source of the problem, implementing corrective actions, and checking the effectiveness of those actions. It categorizes analytical errors into clerical, systematic, and random errors, providing guidance on identifying common causes and necessary corrective actions. Additionally, it emphasizes the importance of monitoring performance over time to assess the impact of corrective measures.EQA: An Essential Tool for Laboratory Quality - Africa LT649
EQA: An Essential Tool for Laboratory Quality - Africa LT649 Randox
╠²
External quality assessment (EQA) is crucial for ensuring laboratory accuracy and reliability, as 75% of diagnoses rely on lab test results. EQA, alongside internal quality control (IQC), helps identify laboratory errors, improve performance, reduce repeat tests, and ultimately minimize patient risk. Real-life testimonials highlight the significant benefits of EQA in various laboratories, demonstrating its effectiveness in enhancing quality and confidence in test results.How often is Right for Laboratory Quality Control?
How often is Right for Laboratory Quality Control?Randox
╠²
Laboratories must determine the appropriate frequency for quality control (QC) based on various factors, including assay stability, volume of patient samples, and risk associated with erroneous results. Regularly asking the right questions is crucial to identify high-risk and unstable tests, ensuring QC evaluations are timely and effective. Ultimately, while daily QC may be common, frequency should be tailored to specific lab conditions and procedures to ensure accurate patient results and minimize potential harm.Corrective & Preventive Action
Corrective & Preventive Actionkiranreddy munnangi
╠²
This document discusses Corrective and Preventive Action (CAPA) processes. It defines correction, corrective action, and preventive action. Correction provides an immediate remedy but does not fix the root cause. Corrective action eliminates the cause of nonconformity to prevent recurrence. Preventive action anticipates potential problems. Examples are provided such as replacing a clogged U-trap to correct a leaky sink, and checking other sinks to prevent future issues. The CAPA process involves identifying issues, investigating root causes, developing action plans, implementing solutions, and verifying effectiveness. CAPA is important for continuously improving quality in an organization.Laboratory Internal Quality Control presentation master revision, 2014
Laboratory Internal Quality Control presentation master revision, 2014Adel Elazab Elged
╠²
This document outlines the importance of internal quality control (IQC) in clinical pathology, detailing its procedures, including daily monitoring to ensure reliable and reproducible test results. It discusses various statistical methods like Levey-Jennings charts and Westgard rules for maintaining quality, alongside troubleshooting techniques when tests are out of control. The ultimate goal is to ensure accurate laboratory testing through careful management and analysis of quality control materials.Quality control program 05042018
Quality control program 05042018Syed Basheer
╠²
This document provides an overview of quality control programs in medical laboratories. It defines key terms related to quality control such as accuracy, bias, calibration, standard deviation, and Westgard rules. The Westgard rules are statistical approaches used to detect errors in analytical testing by monitoring quality control sample measurements. The document explains concepts like standard deviation, coefficient of variation, and standard deviation index which are used to statistically analyze quality control sample results.Some illustrative examples on the analysis of the SW-CRT
Some illustrative examples on the analysis of the SW-CRTNIHR CLAHRC West Midlands
╠²
The document discusses the analysis of stepped wedge cluster randomized trials (SW-CRTs), emphasizing the confounding effect of calendar time on study results. It presents examples of two interventions, one related to maternity sweeping and another concerning critical care outreach, highlighting the need for careful modeling to adjust for temporal effects in the evaluation of treatment impacts. The importance of considering time as a covariate in analyses and the requirement for sufficient statistical power for model extensions is also underscored.Similar to Medication Delivery Turnaround Time (20)
Health Care Improvement By Management Tools
Health Care Improvement By Management ToolsDr.Ashok Khandelwal
╠²
The document discusses various management techniques that can be used to improve healthcare delivery and lower costs. These include PDCA (Plan-Do-Check-Act) cycle, Six Sigma, balanced scorecard, Lean methodology, business process reengineering, and benchmarking. Case studies are provided that demonstrate how these techniques were used to reduce prolonged hospital stays, delays in lab and ultrasound reports, and surgical infections.QSIR knowledge exchange - Matt Tite presentation
QSIR knowledge exchange - Matt Tite presentationNHS Improving Quality
╠²
The document outlines a quality improvement program aimed at enhancing healthcare delivery based on the five-year forward view, focusing on diagnosis and treatment for cancer and other health services. It emphasizes the importance of using statistical process control (SPC) and Pareto analysis to identify issues in healthcare quality and capacity management. Additionally, it discusses capacity and demand management in primary care, suggesting that effective planning must take into account seasonal variations and different demand patterns throughout the week.Modern quality systems in pharmaceutical education and industries
Modern quality systems in pharmaceutical education and industriesKoshish Gabhane
╠²
The document discusses quality systems and tools used in pharmaceutical education and industries, including Six Sigma. It provides details on Six Sigma and how it has been applied successfully in various case studies, including reducing transcription errors and delays in a medical transcription business and improving processes in educational institutions. Modern quality tools like Six Sigma focus on reducing defects, meeting customer requirements, and improving processes to increase quality and efficiency.Process Improvement ProjectProcess IdentificationIn this
Process Improvement ProjectProcess IdentificationIn thisDaliaCulbertson719
╠²
The document discusses a process improvement project focused on enhancing the service of an a la carte menu through the DMAIC methodology. It identifies inefficiencies in the current process, such as the lack of menu availability for customers and inadequate consultation on payment methods, which hinder service quality. Additionally, guidelines for creating a data collection plan and process mapping are provided to support systematic improvement efforts.Toolsofthe trade1
Toolsofthe trade1shailajaspai
╠²
This document outlines the goals, structure, and content of a three-day training program on continuous quality improvement. The program aims to teach a standardized quality improvement methodology and skills in applying those methods. It seeks to demystify the process and involve all staff, not just quality managers. Over the three days, participants will learn about quality improvement tools and frameworks, complete a quality improvement project by applying those tools, and present their project outcomes. The first day covers defining quality, different improvement methodologies, establishing a project team and aim, and using tools like flowcharts and cause-and-effect diagrams to diagnose issues.Lean Six Sigma
Lean Six SigmaMentari Pagi
╠²
This document provides an overview of Lean Six Sigma and its application in healthcare. It discusses Lean Six Sigma concepts like eliminating waste, enhancing value-added operations, and reducing process variation. Examples of Lean Six Sigma projects at St. Elizabeth Regional Health are presented, focusing on improving patient outcomes, safety, and throughput while controlling costs. Common Lean and Six Sigma tools are outlined, such as process mapping and statistical process control. The benefits of Six Sigma level performance for reducing errors and defects are also reviewed.U Of I ║▌║▌▀Żs 11 09
U Of I ║▌║▌▀Żs 11 09rblackwell46
╠²
The document summarizes an industrial engineering project at Cermak Health Services, which provides healthcare to detainees at Cook County Jail. The project aimed to improve the medication administration process, which was not meeting requirements to deliver medications within 24 hours. Using Six Sigma methodology, the industrial engineers mapped current processes, identified inefficiencies, and are implementing improvements such as standardizing processes, reducing non-value-added steps, and leveraging a new computer system. The project demonstrates how industrial engineering techniques can be applied in healthcare to improve quality and efficiency.Comp10 unit6a lecture_slides
Comp10 unit6a lecture_slidesCMDLMS
╠²
The document discusses strategies for optimizing health care workflow processes through process redesign. It identifies 27 strategies for improving efficiency, such as automation, centralization, control addition, and task elimination. Specific examples of how each strategy could be applied in a health care clinic setting are provided, such as using computer systems to automate prescription refills, centralizing phone call handling, and eliminating redundant tasks through automation. The overall goals of process redesign are improving quality of care, enhancing patient experience, reducing costs, and making clinic workflows more efficient.Microsystem analysis webinar_feb_21_2013[1]
Microsystem analysis webinar_feb_21_2013[1]Carol Callaway-Lane
╠²
This document discusses the importance of evaluating a clinical microsystem before implementing quality improvement changes. It defines a microsystem as a small team that provides care to a discrete patient population. Evaluating the microsystem using the "5 P's" - purpose, patients, professionals, processes, and patterns - provides an understanding of the current state. This understanding is necessary to develop effective improvements and avoid unintended consequences.Value Stream Mapping at HRVP case report
Value Stream Mapping at HRVP case reportCarlos Frederico Pinto
╠²
1) The authors conducted a value stream mapping (VSM) at a medical oncology unit to improve inefficient processes around chemotherapy prescriptions, authorizations, filling, and billing that took two days to complete.
2) The VSM identified problems like poor integration between processes, multiple handoffs of patient charts, and a lack of necessary information available to all involved.
3) Using lean tools like spaghetti diagrams and error proofing, the team proposed solutions like streamlining patient and information flows, creating a patient chart supermarket, and pre-filling prescriptions.
4) Measurements showed an 84% reduction in lead time, 36% reduction in cycle time, andCase study on Six Sigma (2014 ExL Conference)
Case study on Six Sigma (2014 ExL Conference)George Betts, MBA, CPM
╠²
The document outlines a case study on improving productivity and reducing costs in clinical development at Ipsen using the DMAIC framework of Six Sigma. It highlights the challenges of rising drug development costs and slow clinical trial execution, and details a structured approach involving defining problems, measuring current processes, analyzing root causes, implementing improvements, and establishing control measures. Key metrics and team collaboration are emphasized as essential for success in this initiative.2011 CMIO Summit | Justin Graham
2011 CMIO Summit | Justin GrahamTriMed Media Group
╠²
This document summarizes strategies for clinician adoption after an EHR go-live presented by Dr. Justin Graham. It recommends embedding HIT into organizational strategy, evolving governance from projects to operations, having realistic EHR expectations, setting virtuous workflow cycles, preparing for requests, learning informatics team management, and keeping vision and momentum. Culture change takes time and an engaged clinical leader, informatics team, and communication plan are important for adoption.A Lean Six Sigma Case Study If you want to prosp
A Lean Six Sigma Case Study If you want to prospmecklenburgstrelitzh
╠²
This case study applies Lean Six Sigma methodologies to address the issue of long patient wait times in Dr. Deasley's primary care practice. With staff turnover and patient dissatisfaction leading to decreased revenue, the project focuses on improving workflow to meet patient demands and enhance employee morale within three months. Various tools such as DMAIC phases, data collection plans, and charts are introduced to systematically identify problems, analyze causes, implement improvements, and monitor progress.Improving clinical care_through_quality_improvement_april_23_2012_final
Improving clinical care_through_quality_improvement_april_23_2012_finalCarol Callaway-Lane
╠²
This document discusses strategies for using measurement to drive quality improvement in clinical practice. It outlines the following key points:
1. Measurement is crucial for both discovery of issues and evaluating actual changes. Tally sheets and Pareto charts can identify root causes, while process measures track baseline data and monitor improvement.
2. The Model for Improvement emphasizes setting aims, measures, and testing changes through small Plan-Do-Study-Act cycles. Measures should be agile, accurate, and accessible.
3. A case study demonstrates using these strategies to address late patient rooming. Baseline data identified room availability as the main issue. Adding a room and optimizing workflow reduced late rooming by 34% over severalJan de Sitter - IT & health care delivery
Jan de Sitter - IT & health care deliveryRoald Sieberath
╠²
IT systems can help manage healthcare quality by:
1) Enabling information sharing between medical professionals and across sites through electronic medical records and order communication systems.
2) Supporting evidence-based, well-defined care processes through tools like clinical pathways and decision support.
3) Allowing measurement of quality indicators and evaluation of care delivery through structured documentation, coding, and data analysis.ISPS 2007
ISPS 2007jppattanaik
╠²
This document summarizes a study using Six Sigma to optimize the process of a health check-up package. The current process takes an average of 9 hours and 7 minutes with high variation. The goal is to reduce the cycle time and variation to meet customer expectations of 7 hours or less. Process mapping and data analysis identified sources of waste and non-value-added activities. Suggested improvements include implementing an appointment system, queue modeling, and restructuring resources to centralize coordination and improve workflow. A pilot test achieved a cycle time of 2 hours and 40 minutes with lower variation, showing potential for further optimization.Six Sigma: Defining the Problem
Six Sigma: Defining the Problemljmcneill33
╠²
This document discusses Six Sigma methodology for improving processes in healthcare. It provides an overview of key Six Sigma concepts and terms, as well as the Define, Measure, Analyze, Improve, Control (DMAIC) process improvement framework. The document uses an example of reducing the time to notify clinicians of critical lab values to illustrate how the DMAIC method would be applied in a healthcare setting.Final fiesta paper template
Final fiesta paper templateJulie Sanchez
╠²
This document outlines the six steps to behavior systems analysis for a student project. It includes sections for analyzing natural contingencies, specifying performance objectives, designing an intervention, implementing the intervention, evaluating the intervention, and recycling through previous steps if needed. Diagrams and descriptions are included for various models and forms, such as input-process-output models, goal specification forms, and cultural change models. The document provides a framework for students to apply behavioral principles to analyze a problem and design a solution within an organizational setting.Lean presentation amc
Lean presentation amcWafa AlAhmed
╠²
The document outlines the application of lean thinking principles at the Arab Medical Center, emphasizing value creation and waste elimination to improve healthcare services. It details the types of waste identified in the phlebotomy workflow, methods for reducing patient wait times, and the implementation of standardized work practices for better efficiency and safety. Additionally, it discusses the PDCA cycle for continuous improvement and employee involvement in the process.Pbi Marcus Evans Sept2011presentation
Pbi Marcus Evans Sept2011presentationMichaelMcNamara
╠²
The document discusses approaches for reengineering laboratory processes to accelerate business output. It provides an overview of a mini workshop focusing on scheduling in the laboratory and process mapping, particularly value stream mapping. The workshop aims to review efficiency improvement approaches, apply tools like scheduling and process mapping to a case study, and review lessons learned.Ad
Medication Delivery Turnaround Time
- 1. Presented By Dr. Vinod Prabhu & Sameer Murdeshwar Institute of Management Technology, Dubai (DIAC)
- 2. ’üĮ Objectives of the Study ’üĮ Brief History of Six Sigma ’üĮ Six Sigma in the Healthcare Industry ’üĮ Time frame ’üĮ End Outcome ’üĮ The DMAIC Methodology ŌŚ” Define ŌŚ” Measure ŌŚ” Analyze ŌŚ” Improve ŌŚ” Control
- 3. ’üĮ To look for an existing process in the hospital which has a scope for significant improvement ’üĮ Six Sigma methodology would be the choice for the process improvement ’üĮ Chosen focus area is the Medication Delivery Turnaround Time for newly admitted patients
- 4. ’üĮ Blakslee (1999, July) refers to Six Sigma as ŌĆ£a high-performance, data-driven approach to analyzing the root causes of business problems and solving themŌĆØ ’üĮ Originally developed by Bill Smith, a reliability engineer working for Motorola in 1986 ’üĮ Adopted by GE in the 1990s
- 5. ’üĮ Ever-growing number of health care organizations are using Six Sigma to improve processes from admissions to discharges and all the administrative and clinical processes in between ’üĮ Driven by several factors including the need to improve the organizationŌĆÖs bottom- line, eliminate medical errors and position themselves for an imminent global customer - centred health care revolution
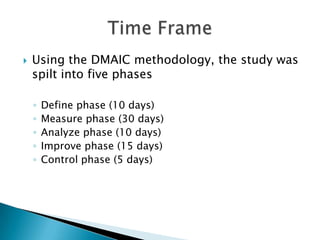
- 6. ’üĮ Using the DMAIC methodology, the study was spilt into five phases ŌŚ” Define phase (10 days) ŌŚ” Measure phase (30 days) ŌŚ” Analyze phase (10 days) ŌŚ” Improve phase (15 days) ŌŚ” Control phase (5 days)
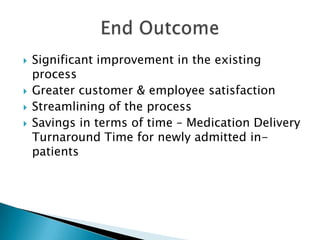
- 7. ’üĮ Significant improvement in the existing process ’üĮ Greater customer & employee satisfaction ’üĮ Streamlining of the process ’üĮ Savings in terms of time ŌĆō Medication Delivery Turnaround Time for newly admitted in- patients
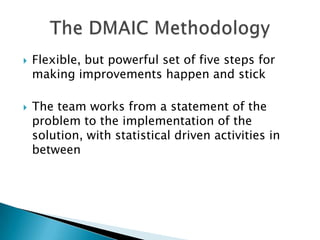
- 8. ’üĮ Flexible, but powerful set of five steps for making improvements happen and stick ’üĮ The team works from a statement of the problem to the implementation of the solution, with statistical driven activities in between
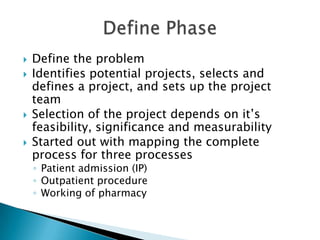
- 9. ’üĮ Define the problem ’üĮ Identifies potential projects, selects and defines a project, and sets up the project team ’üĮ Selection of the project depends on itŌĆÖs feasibility, significance and measurability ’üĮ Started out with mapping the complete process for three processes ŌŚ” Patient admission (IP) ŌŚ” Outpatient procedure ŌŚ” Working of pharmacy
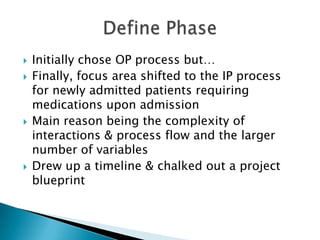
- 10. ’üĮ Initially chose OP process butŌĆ” ’üĮ Finally, focus area shifted to the IP process for newly admitted patients requiring medications upon admission ’üĮ Main reason being the complexity of interactions & process flow and the larger number of variables ’üĮ Drew up a timeline & chalked out a project blueprint
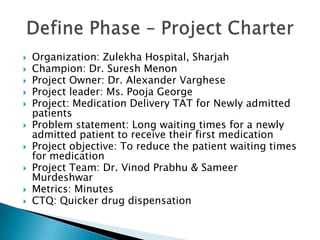
- 11. ’üĮ Organization: Zulekha Hospital, Sharjah ’üĮ Champion: Dr. Suresh Menon ’üĮ Project Owner: Dr. Alexander Varghese ’üĮ Project leader: Ms. Pooja George ’üĮ Project: Medication Delivery TAT for Newly admitted patients ’üĮ Problem statement: Long waiting times for a newly admitted patient to receive their first medication ’üĮ Project objective: To reduce the patient waiting times for medication ’üĮ Project Team: Dr. Vinod Prabhu & Sameer Murdeshwar ’üĮ Metrics: Minutes ’üĮ CTQ: Quicker drug dispensation
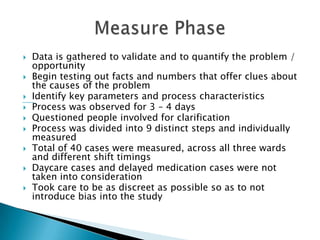
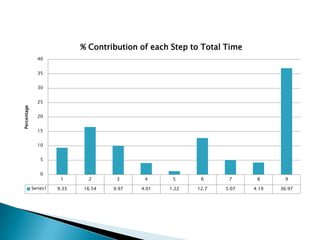
- 12. ’üĮ Data is gathered to validate and to quantify the problem / opportunity ’üĮ Begin testing out facts and numbers that offer clues about the causes of the problem ’üĮ Identify key parameters and process characteristics ’üĮ Process was observed for 3 ŌĆō 4 days ’üĮ Questioned people involved for clarification ’üĮ Process was divided into 9 distinct steps and individually measured ’üĮ Total of 40 cases were measured, across all three wards and different shift timings ’üĮ Daycare cases and delayed medication cases were not taken into consideration ’üĮ Took care to be as discreet as possible so as to not introduce bias into the study
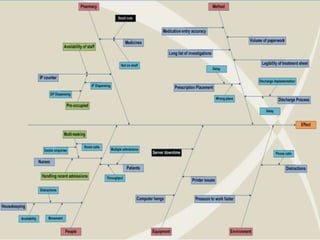
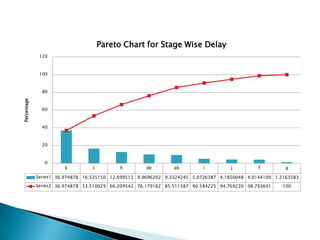
- 15. ’üĮ Identifies the causes of the problem ’üĮ From the various causes, the focus will be on the root cause(s) ’üĮ Begins by combining data, experience, a review of the process, and then forming an initial hypothesis of the cause ’üĮ Root Cause analysis performed ’üĮ Ishikawa (Cause & Effect) Diagram was constructed ’üĮ Pareto Analysis performed ’üĮ Quantitative drill down of the measured numbers ŌĆō Averages, Max time, Min time & Frequency distribution
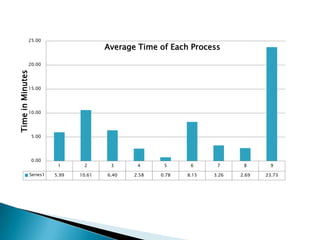
- 17. 25.00 Average Time of Each Process 20.00 Time in Minutes 15.00 10.00 5.00 0.00 1 2 3 4 5 6 7 8 9 Series1 5.99 10.61 6.40 2.58 0.78 8.15 3.26 2.69 23.73
- 18. % Contribution of each Step to Total Time 40 35 30 25 Percentage 20 15 10 5 0 1 2 3 4 5 6 7 8 9 Series1 9.33 16.54 9.97 4.01 1.22 12.7 5.07 4.19 36.97
- 19. Pareto Chart for Stage Wise Delay 120 100 80 Percentage 60 40 20 0 k c h de ab i j f g Series1 36.974878 16.535150 12.699513 9.9696202 9.3324245 5.0726387 4.1850048 4.0144109 1.2163583 Series2 36.974878 53.510029 66.209542 76.179162 85.511587 90.584225 94.769230 98.783641 100
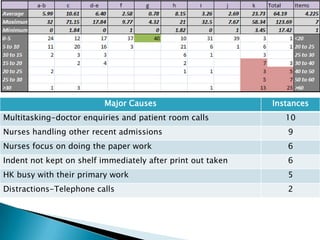
- 20. Major Causes Instances Multitasking-doctor enquiries and patient room calls 10 Nurses handling other recent admissions 9 Nurses focus on doing the paper work 6 Indent not kept on shelf immediately after print out taken 6 HK busy with their primary work 5 Distractions-Telephone calls 2
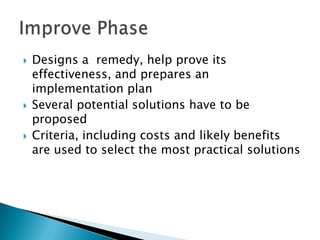
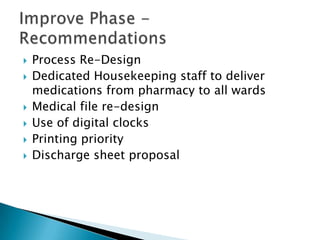
- 21. ’üĮ Designs a remedy, help prove its effectiveness, and prepares an implementation plan ’üĮ Several potential solutions have to be proposed ’üĮ Criteria, including costs and likely benefits are used to select the most practical solutions
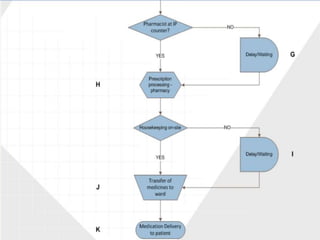
- 22. ’üĮ Process Re-Design ’üĮ Dedicated Housekeeping staff to deliver medications from pharmacy to all wards ’üĮ Medical file re-design ’üĮ Use of digital clocks ’üĮ Printing priority ’üĮ Discharge sheet proposal
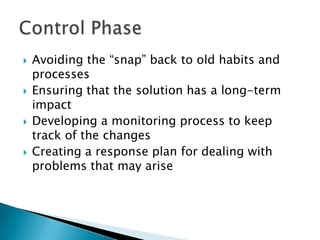
- 23. ’üĮ Avoiding the ŌĆ£snapŌĆØ back to old habits and processes ’üĮ Ensuring that the solution has a long-term impact ’üĮ Developing a monitoring process to keep track of the changes ’üĮ Creating a response plan for dealing with problems that may arise