Meeting finale rete 3 IAMC
0 likes63 views

Risorse demersali, forzanti ambientali e sforzo di pesca: il caso della GSA16


More Related Content
Featured (20)
Meeting finale rete 3 IAMC
- 1. Risorse demersali, forzanti ambientali e sforzo di pesca: il caso della GSA 16 F. Fiorentino1, V. Lauria1, M. Gristina1, F. Gargano2, G.Milisenda1, G. Garofalo1 1 CNR IAMC di Mazara del Vallo 2 DEIM, Universit├Ā di Palermo
- 2. ŌĆó Ampia variabilit├Ā di habitat; ŌĆó Fenomeni oceanografici di mesoscala rilevanti ; ŌĆó Elevata biodiversit├Ā; ŌĆó Elevata produttivit├Ā di risorse da pesca, in particolare demersali ŌĆ”le caratteristiche della GSA16ŌĆ”
- 3. Profondit├Ā Pendenza Rugosit├Ā SSTSSAL Il pattern spaziale delle principali variabili che influenzano le risorse demersali
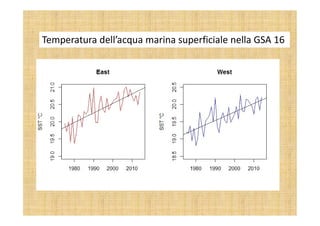
- 4. Temperatura dellŌĆÖacqua marina superficiale nella GSA 16 MyOcean Project (http://www.copernicus.eu/projects/myocean).
- 5. Temperatura dellŌĆÖacqua marina superficiale nella GSA 16
- 6. ŌĆ”I lavori presentati allo scorso meetingŌĆ”.
- 7. ŌĆ”I lavori presentati allo scorso meetingŌĆ”.
- 8. Relazioni tra variabili ambientali e specie di cefalopodi ŌĆó La profondit├Ā ├© il principale predittore ambientale in tutti e quattro i modelli di habitat suitability; ŌĆó Tutte le specie preferiscono habitat con bassi valori di pendenza e rugosit├Ā; ŌĆó Tutte le specie sono associate positivamente alle aree produttive (Clorofilla a), ad eccezione di Eledone moschata; ŌĆó SST influenza positivamente i totani, mentre nessun effetto ├© stato riscontrato per i moscardini; ŌĆó L'effetto della salinit├Ā sulla selezione degli habitat ├© risultato molto variabile; ŌĆó Sia i totani che Eledone cirrhosa prediligono habitat con una maggiore trasparenza dell'acqua, mentre Eledone moschata preferisce acque pi├╣ torbide.
- 9. ŌĆ”analogo studio ├© in corso di finalizzazione per gli elasmobranchiŌĆ”
- 10. LŌĆÖandamento delle risorse demersali R┬▓ = 0.1544 0 10000 20000 30000 40000 50000 60000 70000 80000 1993 1995 1997 1999 2001 2003 2005 2007 2009 2011 2013 2015 N/km2 Indice di densit├Ā totale Medits GSA 16
- 11. LŌĆÖandamento delle risorse demersali 0 5000 10000 15000 20000 25000 30000 35000 40000 1993 1995 1997 1999 2001 2003 2005 2007 2009 2011 2013 2015 N/km2 Indice di densit├Ā Teleostei Medits GSA 16 0 100 200 300 400 500 600 700 800 1993 1995 1997 1999 2001 2003 2005 2007 2009 2011 2013 2015 N/km2 Indice di densit├Ā Condroitti Medits GSA 16
- 12. LŌĆÖandamento delle risorse demersali 0 2000 4000 6000 8000 10000 12000 14000 1993 1995 1997 1999 2001 2003 2005 2007 2009 2011 2013 2015 N/km2 Indice di densit├Ā Cefalopodi Medits GSA 16 0 5000 10000 15000 20000 25000 30000 35000 1993 1995 1997 1999 2001 2003 2005 2007 2009 2011 2013 2015 N/km2 Indice di densit├Ā Crostacei Medits GSA 16
- 13. LŌĆÖandamento delle risorse demersali 0 200 400 600 800 1,000 1,200 1,400 1993 1995 1997 1999 2001 2003 2005 2007 2009 2011 2013 2015 kg/km2 Indice di biomassa totale Medits GSA 16
- 14. LŌĆÖandamento delle risorse demersali 0 100 200 300 400 500 600 700 800 900 1993 1995 1997 1999 2001 2003 2005 2007 2009 2011 2013 2015 kg/km2 Indice di biomassa Teleostei Medits GSA 16 0 50 100 150 200 250 1993 1995 1997 1999 2001 2003 2005 2007 2009 2011 2013 2015 kg/km2 Indice di biomassa Condroitti Medits GSA 16
- 15. LŌĆÖandamento delle risorse demersali 0 10 20 30 40 50 60 70 1993 1995 1997 1999 2001 2003 2005 2007 2009 2011 2013 2015 kg/km2 Indice di biomassa Cefalopodi Medits GSA 16 0 10 20 30 40 50 60 70 80 1993 1995 1997 1999 2001 2003 2005 2007 2009 2011 2013 2015 kg/km2 Indice di biomassa Crostacei Medits GSA 16
- 16. ŌĆ”gli andamenti delle principali specie bersaglioŌĆ”
- 17. ŌĆ”i trend monotonici dello standing stockŌĆ”.
- 18. Proporzione di pesci sopra soglia 0 0.05 0.1 0.15 0.2 0.25 0.3 0.35 1993 1995 1997 1999 2001 2003 2005 2007 2009 2011 2013 2015 Plarge soglia 15cm - GSA 16 Medits 0 0.005 0.01 0.015 0.02 0.025 0.03 0.035 0.04 0.045 0.05 1993 1995 1997 1999 2001 2003 2005 2007 2009 2011 2013 2015 Plarge soglia 20cm - GSA 16 Medits
- 19. Proporzione di pesci sopra soglia 0 0.005 0.01 0.015 0.02 0.025 1993 1995 1997 1999 2001 2003 2005 2007 2009 2011 2013 2015 Plarge soglia 25cm - GSA 16 Medits 0 0.002 0.004 0.006 0.008 0.01 0.012 0.014 1993 1995 1997 1999 2001 2003 2005 2007 2009 2011 2013 2015 Plarge soglia 30cm - GSA 16 Medits
- 20. Lunghezza media massima 15 20 25 30 35 40 1993 1995 1997 1999 2001 2003 2005 2007 2009 2011 2013 2015 Lunghezza(cm) L0.95 dei pesci bersaglio
- 21. 3.1 3.2 3.3 3.4 3.5 3.6 3.7 3.8 1990 1995 2000 2005 2010 2015 L50 ARISFOL ŌĆ”lŌĆÖandamento della lunghezza alla maturit├Ā (L50 ) rilevata nei trawl surveys medits nella GSA 16ŌĆ” 0 5 10 15 20 25 30 35 40 1990 1995 2000 2005 2010 2015 L50 HKE 0 0.5 1 1.5 2 2.5 3 3.5 1995 2000 2005 2010 2015 L50 NEPRNOR Spearman rho -0.75 p=0.02 0 5 10 15 20 25 1990 1995 2000 2005 2010 2015 L50 PAGEERY
- 22. Correlazione tra tra variabili ambientali e gruppi di specie (Spearman rho) S_SAL S_SST S_CHL S_SST_lag S_SAL_lag S_CHL_lag fish_N -0.361257055 0.368022657 -0.211969472 0.346547728 0.0036 0.257618 ceph_N 0.392064401 0.119721736 -0.08219183 -0.324309488 0.222857 -0.01392 elasm_N 0.205855736 -0.553772555 0.164753716 0.42625197 0.204635 -0.31147 crust_N -0.281848781 -0.083685842 -0.251187078 0.866562872 0.000679 -0.69854 fish_B -0.373135712 0.142298538 -0.032336562 0.215051677 -0.23343 0.003313 ceph_B -0.278312145 0.345522348 -0.361734792 0.295164157 -0.05532 0.175534 elasm_B -0.042633857 0.673563259 -0.456584384 0.118429976 0.710599 -0.08233 crust_B -0.419133456 0.035498797 -0.113051167 0.517445087 -0.15009 -0.04524 HKE_B -0.431416166 0.015391356 0.142001421 0.16832782 -0.0033 0.189498 HKE_N_rec -0.260820558 0.246029515 0.302268077 -0.268608716 0.260014 0.427281 DPS_B -0.470322693 0.046423239 -0.167112563 0.423842723 -0.233 -0.31459 DPS_N_rec -0.101662747 -0.403277247 0.132826111 0.563299224 0.021644 -0.55056 MUT_B -0.2546982 0.454919515 -0.390066435 0.45250511 -0.0279 -0.02986
- 23. Selaci vs parametri ambientali 37.9 38.0 38.1 38.2 38.3 38.4 3035404550 S_SAL_lag elasm_B p value = 0.006 21.0 21.5 22.0 22.5 3035404550 S_SST elasm_B p value = 0.03 SST (Aprile-Settembre) SAL (Aprile-Settembre anno precedente) Biomassa(kg/km2
- 24. 0.14 0.15 0.16 0.17 20003000400050006000 S_CHL_lag crust_N Crostacei vs parametri ambientali p value = 0.007p value = 0.0001 SST (Aprile-Settembre) Chla (Aprile-Settembre anno precedente) DensitaŌĆÖ(N/km2 21.0 21.5 22.0 22.5 20003000400050006000 S_SST_lag crust_N
- 25. DPS vs parametri ambientali p value = 0.04 SST (Aprile-Settembre anno precedente) DensitaŌĆÖ(N/km2 21.0 21.5 22.0 22.5 5001000150020002500 S_SST_lag DPS_N_rec
- 26. Andamento dello sforzo di pesca e relazione tra sforzo e capacit├Ā della flotta 0 200000 400000 600000 800000 1000000 1200000 1400000 1600000 2002 2004 2006 2008 2010 2012 2014 2016 sforzo(GT*gg) effort >24 effort 6-24 y = 6E-05x + 414.24 R┬▓ = 0.6276 0 100 200 300 400 500 600 0 500000 1000000 1500000 2000000 N┬░dibarche sforzo (GT*gg)
- 27. Spearman rho sforzo di pesca e gruppi di specie average days_at_sea_6-24 average days_at_sea>24 FISH_N 0.224158384 0.274702483 CEP_N -0.398012249 -0.39420427 SEL_N 0.054025363 -0.255446296 CRU_N -0.115552996 0.121854344 FISH_B -0.057592937 -0.005433273 CEP_B -0.301711427 -0.339903875 SEL_B -0.380489121 -0.61204438 CRU_B -0.244187176 -0.277204005 HKE_B -0.338101606 -0.188594583 HKE_rec 0.431185258 0.385808192 DPS_B -0.47552824 -0.446722325 DPS_rec -0.409915917 -0.292603422 MUT_B -0.558692043 -0.582209946 Correlazione tra sforzo di pesca e gruppi di specie (Spearman rho)
- 28. 200000 400000 600000 800000 1000000 1200000 1400000 110120130140150160170 days_at_sea_large SEL_B Selaci vs sforzo di pesca p value = 0.04 Media giornate a mare annue imbarcazioni lft>24 Biomassa(kg/km2
- 29. ŌĆ”cosa contiamo di fare per la GSA 16 per il rapporto finaleŌĆ”. ŌĆó Completare lŌĆÖanalisi sulla SSRR della triglia introducendo lŌĆÖincertezza; ŌĆó Completare lŌĆÖanalisi tra variabili ambientali, sforzo e abbondanza di cefalopodi e selaci; ŌĆó Completare lŌĆÖanalisi degli andamenti nel tempo e delle correlazioni degli indicatori previsti nel progetto; ŌĆó Integrare nellŌĆÖanalisi un ulteriore indicatore di comunit├Ā che dovrebbe essere pi├╣ strettamente sensibile allŌĆÖimpatto della pesca (size spectra)