Metodos avaliacao climatica
- 1. M├®todos de avalia├¦├Żo bioclim├Ītica E. Kr├╝ger PPGEC/UTFPR
- 2. M├®todos adotados na primeira vers├Żo do Zoneamento Bioclim├Ītico Brasileiro ŌĆó Tabelas de Mahoney ŌĆó Diagrama Bioclim├Ītico de Givoni
- 3. Tabelas de Mahoney M├®todo criado na d├®cada de 1970 por Carl Mahoney (AA School, London) para desenho bioclim├Ītico ŌĆó Etapa inicial: obter dados clim├Īticos locais ŌĆó Anota├¦├Żo dos dados em planilhas (Tabelas de Mahoney) ŌĆó Gera├¦├Żo de recomenda├¦├Ąes gerais para projeto Obs: m├®todo relativamente simples e que demanda pouco tempo para ser utilizado
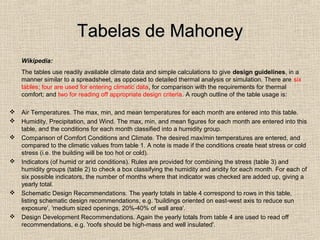
- 4. Tabelas de Mahoney Wikipedia: The tables use readily available climate data and simple calculations to give design guidelines, in a manner similar to a spreadsheet, as opposed to detailed thermal analysis or simulation. There are six tables; four are used for entering climatic data, for comparison with the requirements for thermal comfort; and two for reading off appropriate design criteria. A rough outline of the table usage is: ’üČ Air Temperatures. The max, min, and mean temperatures for each month are entered into this table. ’üČ Humidity, Precipitation, and Wind. The max, min, and mean figures for each month are entered into this table, and the conditions for each month classified into a humidity group. ’üČ Comparison of Comfort Conditions and Climate. The desired max/min temperatures are entered, and compared to the climatic values from table 1. A note is made if the conditions create heat stress or cold stress (i.e. the building will be too hot or cold). ’üČ Indicators (of humid or arid conditions). Rules are provided for combining the stress (table 3) and humidity groups (table 2) to check a box classifying the humidity and aridity for each month. For each of six possible indicators, the number of months where that indicator was checked are added up, giving a yearly total. ’üČ Schematic Design Recommendations. The yearly totals in table 4 correspond to rows in this table, listing schematic design recommendations, e.g. 'buildings oriented on east-west axis to reduce sun exposure', 'medium sized openings, 20%-40% of wall area'. ’üČ Design Development Recommendations. Again the yearly totals from table 4 are used to read off recommendations, e.g. 'roofs should be high-mass and well insulated'.
- 5. Tabelas de Mahoney Adaptadas por M Roriz 1987
- 6. Carta de Givoni 35 Ano Clim├Ītico (TRY e Normais Climatol├│gicas) 30 30 ZONAS: 1. Conforto 2. Ventilacao 25 25 3. Resfriamento Evaporativo 5. Ar Condicionado 20 6. Umidifica├¦├Żo 5 2 7. Massa T├®rmica/ Aquecimento Solar 20 W [ g /k g ] 8. Aquecimento Solar Passivo ] 15 C [┬░ 9. Aquecimento Artificial 15 11.Vent./ Massa/ Resf. Evap. U B T 12.Massa/ Resf. Evap. 10 1 11 10 5 12 0 5 -5 9 8 7 -1 0 -2 0 -1 5 3 6 0 -2 0 -1 5 -1 0 -5 0 5 10 15 20 25 30 35 40 45 50 U F S C - E C V - L a b E E E - N P C T B S [┬░C ] Dados do TRY sobre carta psicrom├®trica (diagrama bioclim├Ītico) ŌĆō software Analysis Bio
- 7. Ano Clim├Ītico (TRY e Normais Climatol├│gicas) Dados das Normais Climatol├│gicas sobre carta psicrom├®trica (diagrama bioclim├Ītico) Fonte INMET para download de Normais Climatol├│gicas: http://www.inmet.gov.br/


![Carta de Givoni 35
Ano Clim├Ītico (TRY e Normais Climatol├│gicas)
30
30
ZONAS:
1. Conforto
2. Ventilacao 25
25
3. Resfriamento Evaporativo
5. Ar Condicionado
20
6. Umidifica├¦├Żo 5
2
7. Massa T├®rmica/ Aquecimento Solar 20
W [ g /k g ]
8. Aquecimento Solar Passivo
]
15
C
[┬░
9. Aquecimento Artificial 15
11.Vent./ Massa/ Resf. Evap. U
B
T
12.Massa/ Resf. Evap. 10 1 11 10
5 12
0 5
-5 9 8 7
-1 0
-2 0 -1 5 3
6
0
-2 0 -1 5 -1 0 -5 0 5 10 15 20 25 30 35 40 45 50
U F S C - E C V - L a b E E E - N P C
T B S [┬░C ]
Dados do TRY sobre carta psicrom├®trica (diagrama
bioclim├Ītico) ŌĆō software Analysis Bio](https://image.slidesharecdn.com/metodosavaliacaoclimatica-130302132733-phpapp02/85/Metodos-avaliacao-climatica-6-320.jpg)
