![Example:
’āś Suppose that the minimum and maximum values for the
attribute income are $12,000 and $98,000, respectively.
We would like to map income to the range [0.0, 1.0].
’āś Suppose that the mean and standard deviation of the
values for the attribute income are $54,000 and $16,000,
respectively.
’āś Suppose that the recorded values of A range from ŌĆō986 to
917.
22](https://image.slidesharecdn.com/ml-chaptertwo-datapreprocessing-220804154815-500e0f53/85/ML-ChapterTwo-Data-Preprocessing-ppt-22-320.jpg)
![Normalization
’āś Min-max normalization:
ŌĆō Ex. Let income range $12,000 to $98,000 is normalized to
[0.0, 1.0]. Then $73,600 is mapped to
’āś Z-score normalization (╬╝: mean, Žā: standard deviation):
ŌĆō Ex. Let ╬╝ = 54,000, Žā = 16,000. Then,
’āś Decimal scaling: Suppose that the recorded values of A range from -986 to
917. To normalize by decimal scaling, we therefore divide each value by 1000
(i.e., j = 3) so that -986 normalizes to -0.986 and 917 normalizes to 0.917.
716
.
0
0
)
0
0
.
1
(
000
,
12
000
,
98
000
,
12
600
,
73
’ĆĮ
’Ć½
’ĆŁ
’ĆŁ
’ĆŁ
newMin
newMin
newMax
min
max
min
v
v
A
A
A
’Ć½
’ĆŁ
’ĆŁ
’ĆŁ
’ĆĮ )
(
'
A
A
v
v
’ü│
’üŁ
’ĆŁ
’ĆĮ
'
225
.
1
000
,
16
000
,
54
600
,
73
’ĆĮ
’ĆŁ
23](https://image.slidesharecdn.com/ml-chaptertwo-datapreprocessing-220804154815-500e0f53/85/ML-ChapterTwo-Data-Preprocessing-ppt-23-320.jpg)
![Binning
’āś Attribute values (for one attribute e.g., age):
’üÉ 0, 4, 12, 16, 16, 18, 24, 26, 28
’āś Equi-width binning ŌĆō for bin width of e.g., 10:
’üÉ Bin 1: 0, 4 [-,10) bin
’üÉ Bin 2: 12, 16, 16, 18 [10,20) bin
’üÉ Bin 3: 24, 26, 28 [20,+) bin
’üÉ ŌĆō denote negative infinity, + positive infinity
’āś Equi-frequency binning ŌĆō for bin density of e.g.,
3:
’üÉ Bin 1: 0, 4, 12 [-, 14) bin
’üÉ Bin 2: 16, 16, 18 [14, 21) bin
’üÉ Bin 3: 24, 26, 28 [21,+] bin
25](https://image.slidesharecdn.com/ml-chaptertwo-datapreprocessing-220804154815-500e0f53/85/ML-ChapterTwo-Data-Preprocessing-ppt-25-320.jpg)


More Related Content
Similar to ML-ChapterTwo-Data Preprocessing.ppt (20)
Recently uploaded (20)


![PLAN_OF_WORK_PPT_BY_ROHIT_BHAIRAM_--2212020201003[1] new.pptx](https://cdn.slidesharecdn.com/ss_thumbnails/planofworkpptbyrohitbhairam-22120202010031new-250329072214-99e4fccd-thumbnail.jpg?width=560&fit=bounds)


ML-ChapterTwo-Data Preprocessing.ppt
- 1. Machine Learning Chapter Two: Data Preprocessing
- 2. 1. Overview of data preprocessing ’āś Machine Learning requires collecting great amount of data to achieve the intended objective. ’āś A real-world data generally contains an unusable format which cannot be directly used for machine learning models. ’āś Before feeding data to ML, we have to make sure the quality of data? ’āś Data preprocessing is a process of preparing the raw data and making it suitable for a machine learning model. ’āś It is the crucial step while creating a machine learning model. ’āś It increases the accuracy and efficiency of a machine learning model.
- 3. Data Quality ’āś A well-accepted multidimensional data quality measures are the following: ’üÉ Accuracy (free from errors and outliers) ’üÉ Completeness (no missing attributes and values) ’üÉ Consistency (no inconsistent values and attributes) ’üÉ Timeliness (appropriateness of the data for the purpose it is required) ’üÉ Believability (acceptability) ’üÉ Interpretability (easy to understand) 3
- 4. Why Data Preprocessing? ’āś Most of the data in the real world are poor quality (Incomplete, Inconsistent, Noisy, Invalid, Redundant, ŌĆ”) ’üÉ incomplete: lacking attribute values, lacking certain attributes of interest, or containing only aggregate data ’é¦ e.g., occupation=ŌĆ£ ŌĆØ ’üÉ noisy: containing errors or outliers ’é¦ e.g., Salary=ŌĆ£-10ŌĆØ ’üÉ inconsistent: containing discrepancies in codes or names ’é¦ e.g., Age=ŌĆ£42ŌĆØ Birthday=ŌĆ£03/07/1997ŌĆØ ’é¦ e.g., Was rating ŌĆ£1,2,3ŌĆØ, now rating ŌĆ£A, B, CŌĆØ ’üÉ Redundant: including everything, some of which are irrelevant to our task. ’üÉNo quality data, no quality results! 4
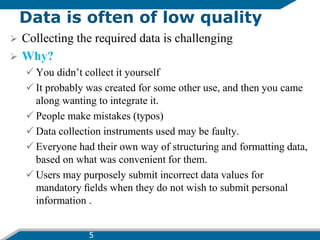
- 5. Data is often of low quality ’āś Collecting the required data is challenging ’āś Why? ’üÉ You didnŌĆÖt collect it yourself ’üÉ It probably was created for some other use, and then you came along wanting to integrate it. ’üÉ People make mistakes (typos) ’üÉ Data collection instruments used may be faulty. ’üÉ Everyone had their own way of structuring and formatting data, based on what was convenient for them. ’üÉ Users may purposely submit incorrect data values for mandatory ’¼üelds when they do not wish to submit personal information . 5
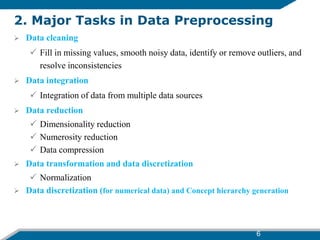
- 6. 6 2. Major Tasks in Data Preprocessing ’āś Data cleaning ’üÉ Fill in missing values, smooth noisy data, identify or remove outliers, and resolve inconsistencies ’āś Data integration ’üÉ Integration of data from multiple data sources ’āś Data reduction ’üÉ Dimensionality reduction ’üÉ Numerosity reduction ’üÉ Data compression ’āś Data transformation and data discretization ’üÉ Normalization ’āś Data discretization (for numerical data) and Concept hierarchy generation
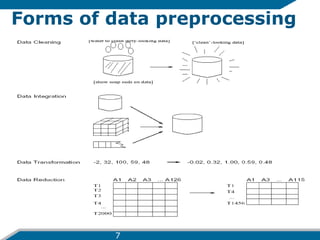
- 7. Forms of data preprocessing 7
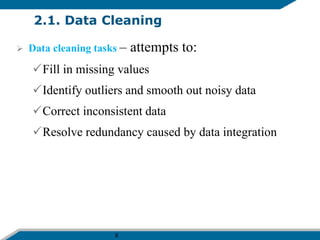
- 8. 8 2.1. Data Cleaning ’āś Data cleaning tasks ŌĆō attempts to: ’üÉFill in missing values ’üÉIdentify outliers and smooth out noisy data ’üÉCorrect inconsistent data ’üÉResolve redundancy caused by data integration
- 9. 9 Incomplete (Missing) Data: ’āś Data is not always available ’üÉ many tuples have no recorded value for several attributes, such as customer income in sales data. ’āś Missing data may be due to ’üÉ equipment malfunction ’üÉ inconsistent with other recorded data and thus deleted ’üÉ data not entered due to misunderstanding ’üÉ certain data may not be considered important at the time of entry ’üÉ not register history or changes of the data.
- 10. 10 How to Handle Missing Value? ’āś Ignore the tuple: ’üÉ usually done when class label is missing (when doing classification). ’üÉ Not effective method unless several attributes missing values ’āś Fill in the missing value manually: tedious + infeasible? ’āś Fill in it automatically with: ’üÉ a global constant : e.g., ŌĆ£unknownŌĆØ, a new class?! ’āś Use a measure of central tendency for the attribute (e.g., the mean or median) to ’¼üll in the missing value ’üÉ Average income of customer $28,000 (use this value to replace). ’āś Use the most probable value : ’üÉ determined with regression, inference-based such as Bayesian formula, or decision tree. (most popular)
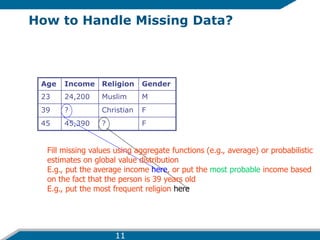
- 11. How to Handle Missing Data? Age Income Religion Gender 23 24,200 Muslim M 39 ? Christian F 45 45,390 ? F Fill missing values using aggregate functions (e.g., average) or probabilistic estimates on global value distribution E.g., put the average income here, or put the most probable income based on the fact that the person is 39 years old E.g., put the most frequent religion here 11
- 12. 12 Noisy Data ’āś Noise-is a random error or variance in a measured variable ’āś Incorrect attribute values may be due to ’üÉ faulty data collection instruments(e.g.: OCR) ’üÉ data entry problems-Let say ŌĆśgreenŌĆÖ is written as ŌĆśrgeenŌĆÖ ’üÉ data transmission problems ’üÉ technology limitation ’üÉ inconsistency in naming convention 12
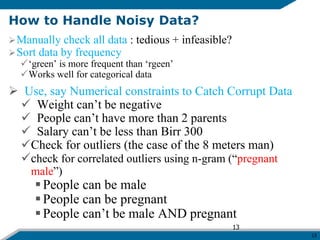
- 13. 13 How to Handle Noisy Data? ’āśManually check all data : tedious + infeasible? ’āśSort data by frequency ’üÉŌĆśgreenŌĆÖ is more frequent than ŌĆśrgeenŌĆÖ ’üÉWorks well for categorical data ’āś Use, say Numerical constraints to Catch Corrupt Data ’ā╝ Weight canŌĆÖt be negative ’ā╝ People canŌĆÖt have more than 2 parents ’ā╝ Salary canŌĆÖt be less than Birr 300 ’ā╝Check for outliers (the case of the 8 meters man) ’ā╝check for correlated outliers using n-gram (ŌĆ£pregnant maleŌĆØ) ’é¦People can be male ’é¦People can be pregnant ’é¦People canŌĆÖt be male AND pregnant 13
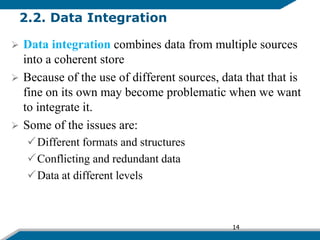
- 14. 2.2. Data Integration ’āś Data integration combines data from multiple sources into a coherent store ’āś Because of the use of different sources, data that that is fine on its own may become problematic when we want to integrate it. ’āś Some of the issues are: ’üÉDifferent formats and structures ’üÉConflicting and redundant data ’üÉData at different levels 14
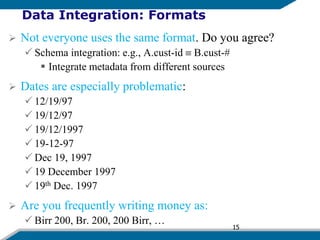
- 15. Data Integration: Formats ’āś Not everyone uses the same format. Do you agree? ’üÉ Schema integration: e.g., A.cust-id ’é║ B.cust-# ’é¦ Integrate metadata from different sources ’āś Dates are especially problematic: ’üÉ 12/19/97 ’üÉ 19/12/97 ’üÉ 19/12/1997 ’üÉ 19-12-97 ’üÉ Dec 19, 1997 ’üÉ 19 December 1997 ’üÉ 19th Dec. 1997 ’āś Are you frequently writing money as: ’üÉ Birr 200, Br. 200, 200 Birr, ŌĆ” 15
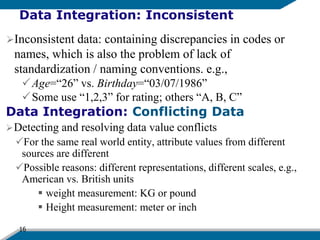
- 16. 16 Data Integration: Inconsistent ’āśInconsistent data: containing discrepancies in codes or names, which is also the problem of lack of standardization / naming conventions. e.g., ’üÉAge=ŌĆ£26ŌĆØ vs. Birthday=ŌĆ£03/07/1986ŌĆØ ’üÉSome use ŌĆ£1,2,3ŌĆØ for rating; others ŌĆ£A, B, CŌĆØ Data Integration: Conflicting Data ’āśDetecting and resolving data value conflicts ’üÉFor the same real world entity, attribute values from different sources are different ’üÉPossible reasons: different representations, different scales, e.g., American vs. British units ’é¦ weight measurement: KG or pound ’é¦ Height measurement: meter or inch
- 17. 17 2.3.Data Reduction Strategies ’āśData reduction: Obtain a reduced representation of the data set that is much smaller in volume but yet produces the same (or almost the same) analytical results ’āśData reduction strategies ’üÉDimensionality reduction, ’é¦ Select best attributes or remove unimportant attributes ’üÉNumerosity reduction ’é¦ Reduce data volume by choosing alternative, smaller forms of data representation ’üÉData compression
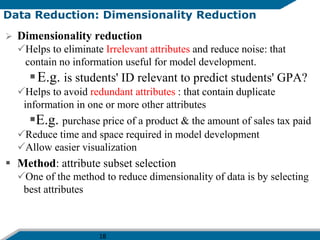
- 18. 18 Data Reduction: Dimensionality Reduction ’āś Dimensionality reduction ’üÉHelps to eliminate Irrelevant attributes and reduce noise: that contain no information useful for model development. ’é¦E.g. is students' ID relevant to predict students' GPA? ’üÉHelps to avoid redundant attributes : that contain duplicate information in one or more other attributes ’é¦E.g. purchase price of a product & the amount of sales tax paid ’üÉReduce time and space required in model development ’üÉAllow easier visualization ’é¦ Method: attribute subset selection ’üÉOne of the method to reduce dimensionality of data is by selecting best attributes
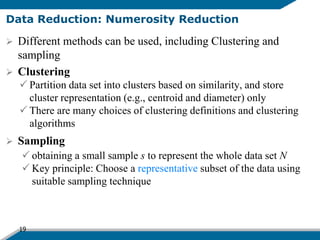
- 19. 19 Data Reduction: Numerosity Reduction ’āś Different methods can be used, including Clustering and sampling ’āś Clustering ’üÉ Partition data set into clusters based on similarity, and store cluster representation (e.g., centroid and diameter) only ’üÉ There are many choices of clustering definitions and clustering algorithms ’āś Sampling ’üÉ obtaining a small sample s to represent the whole data set N ’üÉ Key principle: Choose a representative subset of the data using suitable sampling technique
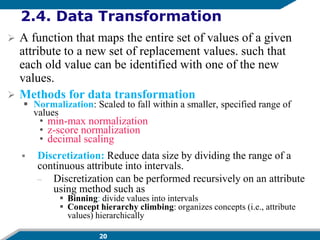
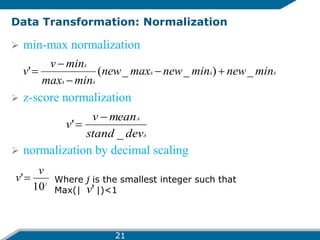
- 20. 20 2.4. Data Transformation ’āś A function that maps the entire set of values of a given attribute to a new set of replacement values. such that each old value can be identified with one of the new values. ’āś Methods for data transformation ’é¦ Normalization: Scaled to fall within a smaller, specified range of values ŌĆó min-max normalization ŌĆó z-score normalization ŌĆó decimal scaling ’é¦ Discretization: Reduce data size by dividing the range of a continuous attribute into intervals. ŌĆō Discretization can be performed recursively on an attribute using method such as ’é¦ Binning: divide values into intervals ’é¦ Concept hierarchy climbing: organizes concepts (i.e., attribute values) hierarchically
- 21. Data Transformation: Normalization ’āś min-max normalization ’āś z-score normalization ’āś normalization by decimal scaling A A A A A A min new min new max new min max min v v _ ) _ _ ( ' ’Ć½ ’ĆŁ ’ĆŁ ’ĆŁ ’ĆĮ A A dev stand mean v v _ ' ’ĆŁ ’ĆĮ j v v 10 '’ĆĮ Where j is the smallest integer such that Max(| |)<1 ' v 21
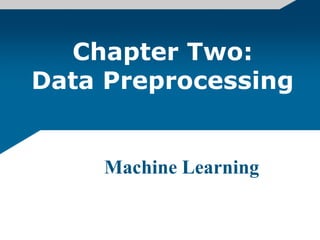
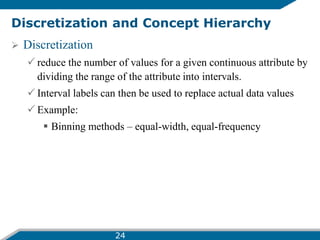
- 22. Example: ’āś Suppose that the minimum and maximum values for the attribute income are $12,000 and $98,000, respectively. We would like to map income to the range [0.0, 1.0]. ’āś Suppose that the mean and standard deviation of the values for the attribute income are $54,000 and $16,000, respectively. ’āś Suppose that the recorded values of A range from ŌĆō986 to 917. 22
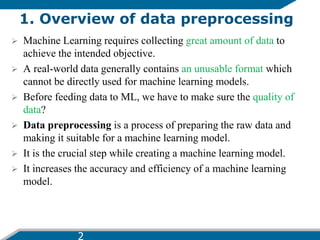
- 23. Normalization ’āś Min-max normalization: ŌĆō Ex. Let income range $12,000 to $98,000 is normalized to [0.0, 1.0]. Then $73,600 is mapped to ’āś Z-score normalization (╬╝: mean, Žā: standard deviation): ŌĆō Ex. Let ╬╝ = 54,000, Žā = 16,000. Then, ’āś Decimal scaling: Suppose that the recorded values of A range from -986 to 917. To normalize by decimal scaling, we therefore divide each value by 1000 (i.e., j = 3) so that -986 normalizes to -0.986 and 917 normalizes to 0.917. 716 . 0 0 ) 0 0 . 1 ( 000 , 12 000 , 98 000 , 12 600 , 73 ’ĆĮ ’Ć½ ’ĆŁ ’ĆŁ ’ĆŁ newMin newMin newMax min max min v v A A A ’Ć½ ’ĆŁ ’ĆŁ ’ĆŁ ’ĆĮ ) ( ' A A v v ’ü│ ’üŁ ’ĆŁ ’ĆĮ ' 225 . 1 000 , 16 000 , 54 600 , 73 ’ĆĮ ’ĆŁ 23
- 24. Discretization and Concept Hierarchy ’āś Discretization ’üÉ reduce the number of values for a given continuous attribute by dividing the range of the attribute into intervals. ’üÉ Interval labels can then be used to replace actual data values ’üÉ Example: ’é¦ Binning methods ŌĆō equal-width, equal-frequency 24
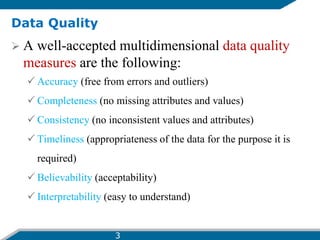
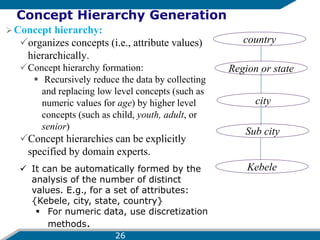
- 25. Binning ’āś Attribute values (for one attribute e.g., age): ’üÉ 0, 4, 12, 16, 16, 18, 24, 26, 28 ’āś Equi-width binning ŌĆō for bin width of e.g., 10: ’üÉ Bin 1: 0, 4 [-,10) bin ’üÉ Bin 2: 12, 16, 16, 18 [10,20) bin ’üÉ Bin 3: 24, 26, 28 [20,+) bin ’üÉ ŌĆō denote negative infinity, + positive infinity ’āś Equi-frequency binning ŌĆō for bin density of e.g., 3: ’üÉ Bin 1: 0, 4, 12 [-, 14) bin ’üÉ Bin 2: 16, 16, 18 [14, 21) bin ’üÉ Bin 3: 24, 26, 28 [21,+] bin 25
- 26. Concept Hierarchy Generation ’āśConcept hierarchy: ’üÉorganizes concepts (i.e., attribute values) hierarchically. ’üÉConcept hierarchy formation: ’é¦ Recursively reduce the data by collecting and replacing low level concepts (such as numeric values for age) by higher level concepts (such as child, youth, adult, or senior) ’üÉConcept hierarchies can be explicitly specified by domain experts. country Region or state city Sub city Kebele ’ā╝ It can be automatically formed by the analysis of the number of distinct values. E.g., for a set of attributes: {Kebele, city, state, country} ’é¦ For numeric data, use discretization methods. 26
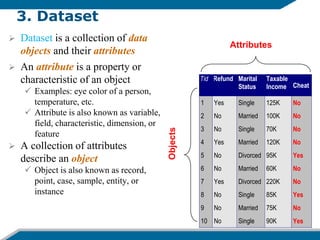
- 27. 3. Dataset ’āś Dataset is a collection of data objects and their attributes ’āś An attribute is a property or characteristic of an object ’üÉ Examples: eye color of a person, temperature, etc. ’üÉ Attribute is also known as variable, field, characteristic, dimension, or feature ’āś A collection of attributes describe an object ’üÉ Object is also known as record, point, case, sample, entity, or instance Tid Refund Marital Status Taxable Income Cheat 1 Yes Single 125K No 2 No Married 100K No 3 No Single 70K No 4 Yes Married 120K No 5 No Divorced 95K Yes 6 No Married 60K No 7 Yes Divorced 220K No 8 No Single 85K Yes 9 No Married 75K No 10 No Single 90K Yes 10 Attributes Objects
- 28. Types of Attributes ’āś The type of an attribute is determined by the set of possible values : nominal, binary, ordinal, or numericŌĆöthe attribute can have. ’āś There are different types of attributes ’üÉNominal- means ŌĆ£relating to namesŌĆØ . ’é¦ The values of a nominal attribute are symbols or names of things. ’é¦ Nominal attributes are also referred to as categorical. ’é¦ Examples: hair-color( Black, Brown, Blond etc.) , Marital- Status(Single, married, divorced and Widowed), Occupation etc. ’üÉOrdinal: ’é¦ an attribute with possible values that have a meaningful order or ranking among them ’é¦ Examples: rankings (e.g., grades, height {tall, medium, short} 28
- 29. Types of Attributes.. ’üÉBinary : ’é¦ is a nominal attribute with only two categories or states: 0-absent or 1-present , Boolean( true or false) ’é¦ Example: Smoker(0-not smoker or 1-smoker) ’üÉInterval-Scaled : Numeric Attributes ’é¦ are measured on a scale of equal-size units. ’é¦ allow us to compare and quantify the difference between values ’é¦ Examples: calendar dates, temperatures in Celsius or Fahrenheit. ’üÉRatio-Scaled: Numeric Attributes ’é¦ a value as being a multiple (or ratio) of another value ’é¦ Examples: temperature in length, time, counts 29
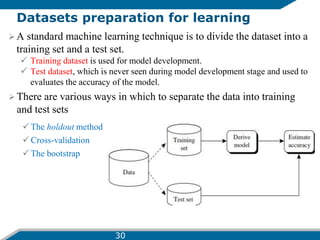
- 30. Datasets preparation for learning ’āśA standard machine learning technique is to divide the dataset into a training set and a test set. ’üÉ Training dataset is used for model development. ’üÉ Test dataset, which is never seen during model development stage and used to evaluates the accuracy of the model. ’āś There are various ways in which to separate the data into training and test sets ’üÉ The holdout method ’üÉ Cross-validation ’üÉ The bootstrap 30
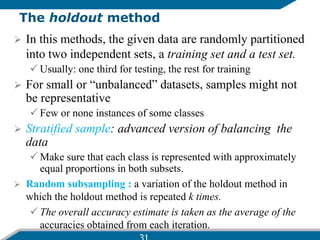
- 31. The holdout method ’āś In this methods, the given data are randomly partitioned into two independent sets, a training set and a test set. ’üÉ Usually: one third for testing, the rest for training ’āś For small or ŌĆ£unbalancedŌĆØ datasets, samples might not be representative ’üÉ Few or none instances of some classes ’āś Stratified sample: advanced version of balancing the data ’üÉ Make sure that each class is represented with approximately equal proportions in both subsets. ’āś Random subsampling : a variation of the holdout method in which the holdout method is repeated k times. ’üÉ The overall accuracy estimate is taken as the average of the accuracies obtained from each iteration.
- 32. 32 Cross-validation ’āś Cross-validation works as follows: ’üÉ First step: data is split into k subsets of equal-sized sets randomly. ’üÉ A partition of a set is a collection of subsets for which the intersection of any pair of sets is empty. That is, no element of one subset is an element of another subset in a partition. ’üÉ Second step: each subset in turn is used for testing and the remainder for training ’üÉThis is called k-fold cross-validation ’üÉ Often the subsets are stratified before the cross-validation is performed ’āś The error estimates are averaged to yield an overall error estimate.
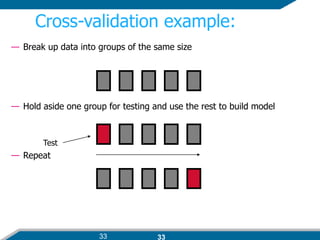
- 33. 33 Cross-validation example: ŌĆö Break up data into groups of the same size ŌĆö Hold aside one group for testing and use the rest to build model ŌĆö Repeat Test 33
- 34. Bootstrap ’āś the bootstrap method samples the given training tuples uniformly with replacement ’āś the machine is allowed to select the same tuple more than once. ’āś A commonly used one is the .632 bootstrap ’āś Suppose we are given a data set of d tuples. The data set is sampled d times, with replacement, resulting in a bootstrap sample or training set of d samples. ’āś The data tuples that did not make it into the training set end up forming the test set. ’āś on average, 63.2% of the original data tuples will end up in the bootstrap sample, and the remaining 36.8% will form the test set (hence, the name, .632 bootstrap) 34
- 35. Assignment ’āś Explain PCA(Principal Component Analysis)how ’āś How it works ’āś Advantage and disadvantage 35