![Polytechnic of Namibia
Fluid Mechanics 610S1
Bernoulliâs Experiment
[Type here]
9/11/2013
Group members
1. E.J.N Conceicao 212086561
2.
3.
4.
5.
6.
7.
8.
9.
10.
Lecturer: Mr Okorie Maduako E. B.Eng. (Mech.), M.
Eng.(Mech.)
Lab. Technician: Isabel Bishi (Mrs), B Tech, Mech. Eng.](https://image.slidesharecdn.com/momlabrevised-141031050637-conversion-gate01/85/Mom-lab-revised-1-320.jpg)


More Related Content
What's hot (20)
Viewers also liked (7)

Similar to Mom lab revised (20)


Mom lab revised
- 1. Polytechnic of Namibia Fluid Mechanics 610S1 Bernoulliâs Experiment [Type here] 9/11/2013 Group members 1. E.J.N Conceicao 212086561 2. 3. 4. 5. 6. 7. 8. 9. 10. Lecturer: Mr Okorie Maduako E. B.Eng. (Mech.), M. Eng.(Mech.) Lab. Technician: Isabel Bishi (Mrs), B Tech, Mech. Eng.
- 2. Introduction The flow of a fluid has to be in agreement with a bunch of scientific principles and theories which follow the conservation of mass and energy. The first of these principles is that a liquid flowing through a conduit requires a steady flow therefore the velocity is constant and will be inversely proportional to the flow area. Secondly the theory states that if a velocity increases then the pressure must decrease. Both Bernoulliâs equation and the continuity equation are essential analytical tools for the design of fluid carrying devices such as (pipes, machines) that is in the subject of fluid mechanics. Aim of practical Therefore the purpose of this lab is to verify Bernoulliâs equation by making use of the P6231 Bernoulliâs apparatus which demonstrates both of the principles stated above which can also examine the turbulence in an accelerating fluid stream. Theory If a load is statically changed with time and applied slowly over a cross-sectional area of a member, its change in behaviour may change and this will produce the graphs in figures 3, 4. These testes are normally conducted at room temperature and the ways in which this load may be applied are as follows, tension which is the method used in this experiment, compression and shear. Tension is the most widely used method to determine the change in the mechanical behaviour of a material during loading. Most of the tension tests are carried out according to the ASTM standard (Standard Test Methods for Tension Testing of Metallic Materials). Equations to be familiar with for the understanding of the mathematical section of the report. ï· To calculate the stressâĶ Force/area (Equation 1) ï· Cross Sectional area= ((Ï/4)*D^2)) (Equation 2) ï· Change in elongation = strain*Gauge length (Equation 3) ï· Tensile Strength (UTS) = Maximum load/Area (Equation 4) ï· Modulus of elasticity= Stress/ Strain (Equation 5) ï· To calculate strain= Change in length/original length (Equation 6) Hypothesis As the tensile load is gradually increased axially the elongation of the specimen is first proportional to the load applied to the material is said to be elastic. However as one keeps on increasing the load, the elastic limit of the specimen is exceeded and it starts yielding. At some point the specimen will reach the plastic region where by the material keeps on elongating without a considerable loading. By continuously increasing the load the material starts to strain harden, whereby changes in the internal structure occur, so the material will not elongate that much as one increases the load. This will cause the specimen to fracture with little application of the load.
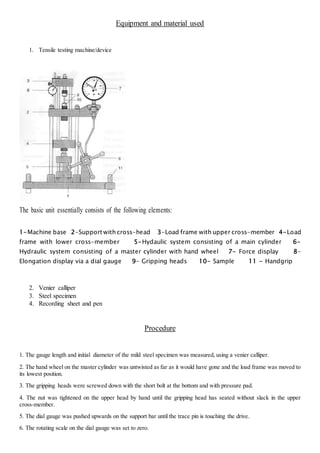
- 3. Equipment and material used 1. Tensile testing machine/device The basic unit essentially consists of the following elements: 1-Machine base 2-Support with cross-head 3-Load frame with upper cross-member 4-Load frame with lower cross-member 5-Hydaulic system consisting of a main cylinder 6- Hydraulic system consisting of a master cylinder with hand wheel 7- Force display 8- Elongation display via a dial gauge 9- Gripping heads 10- Sample 11 - Handgrip 2. Venier calliper 3. Steel specimen 4. Recording sheet and pen Procedure 1. The gauge length and initial diameter of the mild steel specimen was measured, using a venier calliper. 2. The hand wheel on the master cylinder was untwisted as far as it would have gone and the load frame was moved to its lowest position. 3. The gripping heads were screwed down with the short bolt at the bottom and with pressure pad. 4. The nut was tightened on the upper head by hand until the gripping head has seated without slack in the upper cross-member. 5. The dial gauge was pushed upwards on the support bar until the trace pin is touching the drive. 6. The rotating scale on the dial gauge was set to zero.
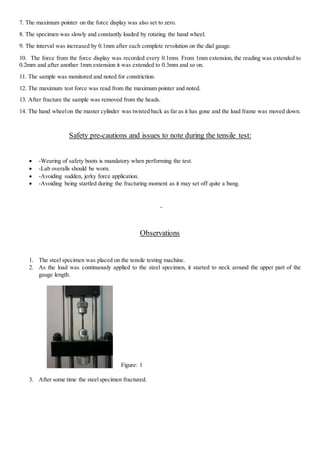
- 4. 7. The maximum pointer on the force display was also set to zero. 8. The specimen was slowly and constantly loaded by rotating the hand wheel. 9. The interval was increased by 0.1mm after each complete revolution on the dial gauge. 10. The force from the force display was recorded every 0.1mm. From 1mm extension, the reading was extended to 0.2mm and after another 1mm extension it was extended to 0.3mm and so on. 11. The sample was monitored and noted for constriction. 12. The maximum test force was read from the maximum pointer and noted. 13. After fracture the sample was removed from the heads. 14. The hand wheel on the master cylinder was twisted back as far as it has gone and the load frame was moved down. Safety pre-cautions and issues to note during the tensile test: ï· -Wearing of safety boots is mandatory when performing the test. ï· -Lab overalls should be worn. ï· -Avoiding sudden, jerky force application. ï· -Avoiding being startled during the fracturing moment as it may set off quite a bang. - Observations 1. The steel specimen was placed on the tensile testing machine. 2. As the load was continuously applied to the steel specimen, it started to neck around the upper part of the gauge length. Figure: 1 3. After some time the steel specimen fractured.
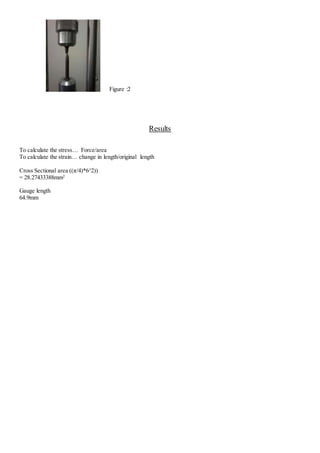
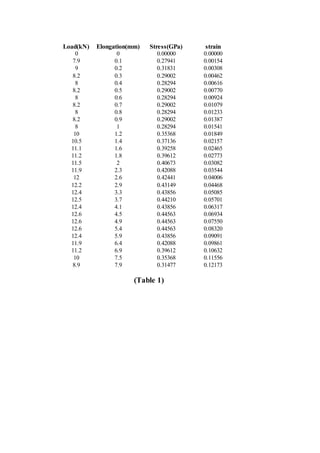
- 5. Figure :2 Results To calculate the stressâĶ Force/area To calculate the strainâĶ change in length/original length Cross Sectional area ((Ï/4)*6^2)) = 28.27433388mm2 Gauge length 64.9mm
- 6. Load(kN) Elongation(mm) Stress(GPa) strain 0 0 0.00000 0.00000 7.9 0.1 0.27941 0.00154 9 0.2 0.31831 0.00308 8.2 0.3 0.29002 0.00462 8 0.4 0.28294 0.00616 8.2 0.5 0.29002 0.00770 8 0.6 0.28294 0.00924 8.2 0.7 0.29002 0.01079 8 0.8 0.28294 0.01233 8.2 0.9 0.29002 0.01387 8 1 0.28294 0.01541 10 1.2 0.35368 0.01849 10.5 1.4 0.37136 0.02157 11.1 1.6 0.39258 0.02465 11.2 1.8 0.39612 0.02773 11.5 2 0.40673 0.03082 11.9 2.3 0.42088 0.03544 12 2.6 0.42441 0.04006 12.2 2.9 0.43149 0.04468 12.4 3.3 0.43856 0.05085 12.5 3.7 0.44210 0.05701 12.4 4.1 0.43856 0.06317 12.6 4.5 0.44563 0.06934 12.6 4.9 0.44563 0.07550 12.6 5.4 0.44563 0.08320 12.4 5.9 0.43856 0.09091 11.9 6.4 0.42088 0.09861 11.2 6.9 0.39612 0.10632 10 7.5 0.35368 0.11556 8.9 7.9 0.31477 0.12173 (Table 1)
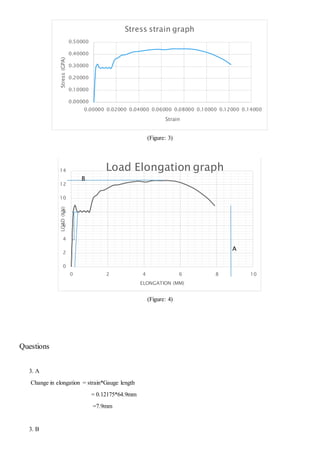
- 7. Stress strain graph (Figure: 3) Load Elongation graph (Figure: 4) Questions 3. A 0.50000 0.40000 0.30000 0.20000 0.10000 14 12 10 8 6 4 2 Change in elongation = strain*Gauge length = 0.12175*64.9mm =7.9mm 3. B 0.00000 0.00000 0.02000 0.04000 0.06000 0.08000 0.10000 0.12000 0.14000 Stress (GPA) Strain 0 0 2 4 6 8 10 LOAD (KN) ELONGATION (MM) B A
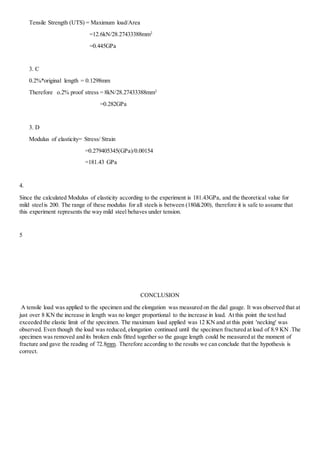
- 8. Tensile Strength (UTS) = Maximum load/Area =12.6kN/28.27433388mm2 =0.445GPa 3. C 0.2%*original length = 0.1298mm Therefore o.2% proof stress = 8kN/28.27433388mm2 =0.282GPa 3. D Modulus of elasticity= Stress/ Strain =0.279405345(GPa)/0.00154 =181.43 GPa 4. Since the calculated Modulus of elasticity according to the experiment is 181.43GPa, and the theoretical value for mild steel is 200. The range of these modulus for all steels is between (180&200), therefore it is safe to assume that this experiment represents the way mild steel behaves under tension. 5 CONCLUSION A tensile load was applied to the specimen and the elongation was measured on the dial gauge. It was observed that at just over 8 KN the increase in length was no longer proportional to the increase in load. At this point the test had exceeded the elastic limit of the specimen. The maximum load applied was 12 KN and at this point 'necking' was observed. Even though the load was reduced, elongation continued until the specimen fractured at load of 8.9 KN .The specimen was removed and its broken ends fitted together so the gauge length could be measured at the moment of fracture and gave the reading of 72.8mm. Therefore according to the results we can conclude that the hypothesis is correct.