


Monitoring liver fibrosis with quantitaive B-Mode ultrasound
- 1. Quantitative Assessment of Diethylnitrosamine-induced Hepatic Fibrosis by Non-Invasive Ultrasound Laith R Sultan MD, Julia C DŌĆÖSouza BSE, Susan M Schultz RDMS, Tong Wu PhD, Terrence Gade MD PhD,Sean D Carlin PhD, Stephen J Hunt MD PhD, Chandra M Sehgal PhD
- 2. ŌØ¢ All authors have no financial disclosures
- 3. Cirrhosis: Diagnosis Ō¢¬ Cirrhosis and liver disease represent the 12th leading cause of death overall, and 5th leading cause of death for 45 - 54 year olds in US Ō¢¬ Liver biopsy is the gold standard for assessing fibrosis and cirrhosis Ō¢¬ Shortcomings of liver biopsy: Ō¢¬ Invasive Ō¢¬ Sampling error: Ō¢¬ Complications
- 4. Objective To evaluate fibrotic changes in a preclinical model using B-mode ultrasound Approach: Ō¢¬ Quantitative, computer-extracted features Ō¢¬ Diethylnitrosamine (DEN)-induced rat model
- 6. Materials & Methods Image and Statistical Analysis Ō¢¬ Sampling: 6 image acquisitions throughout liver 4 - 6 ROIs/image Ō¢¬ Echo-intensity = mean brightness of ROIs Ō¢¬ Heterogeneity = variance of 1st order histogram Ō¢¬ Intragroup ╬ö (temporal progression): ANOVA with subsequent t-tests between three timepoints Ō¢¬ Intergroup ╬ö (DEN vs control): Two-sided t-tests at each timepoint
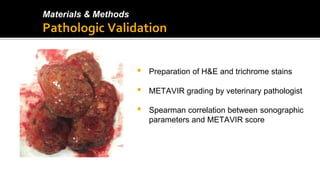
- 7. Ō¢¬ Preparation of H&E and trichrome stains Ō¢¬ METAVIR grading by veterinary pathologist Ō¢¬ Spearman correlation between sonographic parameters and METAVIR score Materials & Methods Pathologic Validation
- 8. DENControl 10 weeks0 weeks 13 weeks Results Echointensity * * * p = 0.001 0w 10w 13w Control 38.1 38.2 38.4 DEN 38.1 56.5 59.6 0.0 10.0 20.0 30.0 40.0 50.0 60.0 70.0 Echointensity
- 9. Echo-intensity: 10 weeks (p = 0.0013), 13 weeks (p = 0.0002) DENControl 10 weeks0 weeks 13 weeks Results Heterogeneity ** * * ** p = 0.005 0w 10w 13w Control 275.3 247.8 245.5 DEN 246.6 524.9 480.7 0.0 100.0 200.0 300.0 400.0 500.0 600.0 700.0 Heterogeneity
- 10. Ō¢¬ DEN rats: METAVIR grades F2-F4 Ō¢¬ Control rats: F0 F3 F4F2 Results Histology
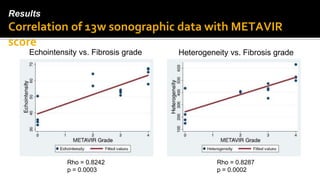
- 11. Results Correlation of 13w sonographic data with METAVIR score Echointensity vs. Fibrosis grade Heterogeneity vs. Fibrosis grade Rho = 0.8242 p = 0.0003 Rho = 0.8287 p = 0.0002
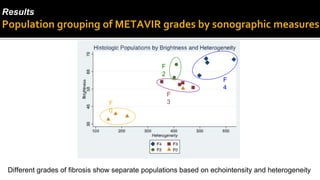
- 12. Different grades of fibrosis show separate populations based on echointensity and heterogeneity Results Population grouping of METAVIR grades by sonographic measures F 4 F 0 F 2 F 3
- 13. Limitations ŌŚ╝ Limited data for intermediate stages of fibrosisŌåÆ Image and sacrifice at earlier time points ŌŚ╝ Similarities in characterization of F2/F3 lesionsŌåÆ Further characterization with additional computerized features
- 14. Conclusion ŌŚ╝ B-mode US tracks fibrotic changes in a rat model. ŌŚ╝ Sonographic features correlate to histology. ŌŚ╝ Potential role for B-mode US for the non-invasive measurement of liver fibrosis.
- 15. Future Directions ŌŚ╝ Preclinical correlation of sonographic features to HCC development ŌŚ╝ Rat model comparison to fibroscan results ŌŚ╝ Comparison of biopsy-proven METAVIR fibrosis scoring with clinical ultrasound measurements
- 16. Thank you! Contact: lsultan@pennmedicine.upenn.edu julia.dsouza@uphs.upenn.edu Stephen.hunt@uphs.upenn.edu Chandra.sehgal@uphs.upenn.edu Penn Ultrasound Research Lab Penn Small Animal Imaging Facility
Editor's Notes
- #4: The most common serious complication of liver biopsy is intraperitoneal hemorrhage, although hematoma and hemobilia can also occur. Other potential complications of liver biopsy include right upper abdominal pain, right shoulder pain, bile peritonitis or pneumothorax. lobar difference between METAVIR grades in up to 24.2% of cases1
- #7: Intragroup Δ (temporal progression): ANOVA Intergroup Δ (DEN vs control): Two-sided t-tests at each timepoint
- #8: Collaboration with colleagues in the vet schoolŌåÆ certified veterinary pathologist blinded to the imaging results graded the histology
- #9: Echo-intensity: Mean liver echo-intensity increased from 42.9 at baseline to 56.4 at 10 weeks (p = 0.0013) reaching the level of 59.9 at 13 weeks (p = 0.0002) from DEN starting time.
- #10: Echo-intensity: Mean liver echo-intensity increased from 42.9 at baseline to 56.4 at 10 weeks (p = 0.0013) reaching the level of 59.9 at 13 weeks (p = 0.0002) from DEN starting time.
- #14: Have an animal model that is useful for studying fibrosisŌåÆ US can be used to track changes Quantitative texturized computer analysis captures the fibrotic changes in an animal model
- #15: Have an animal model that is useful for studying fibrosisŌåÆ US can be used to track changes Quantitative texturized computer analysis captures the fibrotic changes in an animal model
- #16: Have an animal model that is useful for studying fibrosisŌåÆ US can be used to track changes Quantitative texturized computer analysis captures the fibrotic changes in an animal model