Mqbnav001

This document presents an analysis of the impact of electric vehicle (EV) penetration on South Africa's energy demand profile. It examines different EV charging models and their effects on the grid under various penetration rates ranging from 10% to 100%. While high EV penetration rates of 50-100% were found to increase peak energy demand, lower rates of 10-20% did not significantly impact the grid. The document also discusses South Africa's current energy supply and demand, cost considerations for consumers switching to EVs, limitations of EVs, and the potential for vehicle-to-grid technologies to help integrate higher shares of EVs by using batteries to store off-peak energy for sale during peak periods. It concludes that South Africa cannot currently accommodate


Mqbnav001
- 1. MQBNAV001 Naveed Ahmed Maqbool The Impact of Electric Vehicle Penetration on South AfricaĪ»s Demand Profile
- 2. Presentation Structure Literature Review Charging Models Impact of Charging Models on grid Impact of different EV penetration rates on grid South Africa energy supply and demand Impact of EV on Rondebosch Utility Tariff Development Affordability EV Manufacturers Limitations of EVĪ»s V2G Technology Conclusions and Recommendations
- 3. Literature Review What is an EV? How does an EV function? Pollution rates? Internal Combustion versus EV Battery Technologies Li-Ion NiMH PbA Fuel Cell EV versus BEV
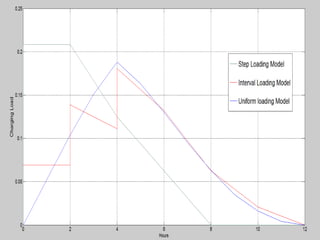
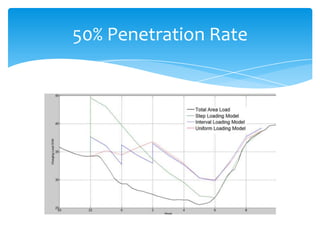
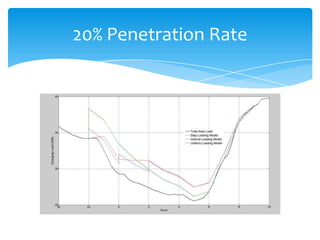
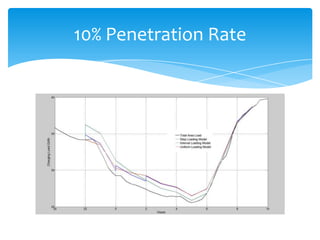
- 4. Charging Models Models developed for different charging patterns Step Loading Model Uniform Loading Model Interval Loading Model
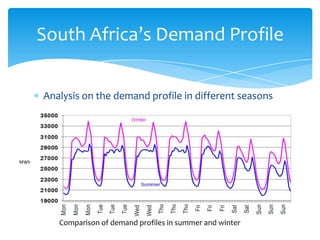
- 6. South AfricaĪ»s Demand Profile Analysis on the demand profile in different seasons MWh Comparison of demand profiles in summer and winter
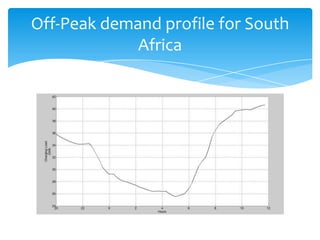
- 7. Off-Peak demand profile for South Africa
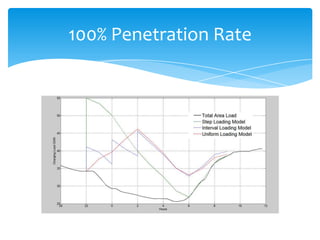
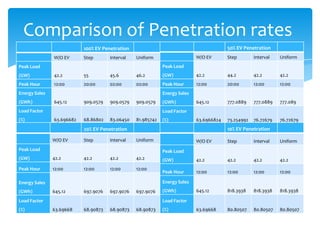
- 12. Comparison of Penetration rates 100% EV Penetration 50% EV Penetration W/O EV Step Interval Uniform W/O EV Step Interval Uniform Peak Load Peak Load (GW) 42.2 55 45.6 46.2 (GW) 42.2 44.2 42.2 42.2 Peak Hour 12:00 20:00 02:00 02:00 Peak Hour 12:00 20:00 12:00 12:00 Energy Sales Energy Sales (GWh) 645.12 909.0579 909.0579 909.0579 (GWh) 645.12 777.0889 777.0889 777.089 Load Factor Load Factor (%) 63.696682 68.86802 83.06450 81.985742 (%) 63.6966824 73.254992 76.72679 76.72679 20% EV Penetration 10% EV Penetration W/O EV Step Interval Uniform W/O EV Step Interval Uniform Peak Load Peak Load (GW) 42.2 42.2 42.2 42.2 (GW) 42.2 42.2 42.2 42.2 Peak Hour 12:00 12:00 12:00 12:00 Peak Hour 12:00 12:00 12:00 12:00 Energy Sales Energy Sales (GWh) 645.12 697.9076 697.9076 697.9076 (GWh) 645.12 818.3938 818.3938 818.3938 Load Factor Load Factor (%) 63.69668 68.90873 68.90873 68.90873 (%) 63.69668 80.80507 80.80507 80.80507
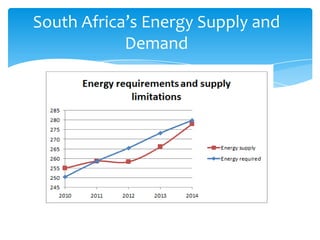
- 13. South AfricaĪ»s Energy Supply and Demand
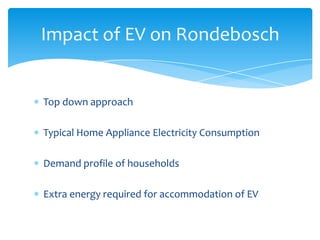
- 14. Impact of EV on Rondebosch Top down approach Typical Home Appliance Electricity Consumption Demand profile of households Extra energy required for accommodation of EV
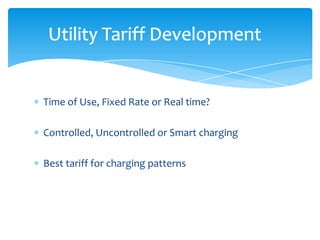
- 15. Utility Tariff Development Time of Use, Fixed Rate or Real time? Controlled, Uncontrolled or Smart charging Best tariff for charging patterns
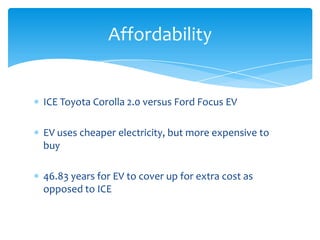
- 16. Affordability ICE Toyota Corolla 2.0 versus Ford Focus EV EV uses cheaper electricity, but more expensive to buy 46.83 years for EV to cover up for extra cost as opposed to ICE
- 17. EV Manufacturers Nissan Motors Ford Motors Toyota Mitsubishi Honda
- 18. Limitations of EVĪ»s Home Work Power Supplies Requirements of an EV model for a grid integration Low power charging Battery swapping Quick charging batteries
- 19. V2G Technology Provide a future for the energy crisis? Store off-peak cheap energy and sell at peak hours
- 20. Conclusions and Recommendations South Africa cannot integrate a large amount of EV penetration at present EV charging should be controlled and charging must be done in off-peak hours V2G technology should be adapted
- 21. Contact Details Naveed Ahmed Maqbool Cell: +27 74 761 8497 Email: Mqbnav001@myuct.ac.za
- 22. Thank You