


MRI IN STROKE RADIOLOGY PRESENTATION...
- 1. MRI FINDINGS IN ISCHEMIC STROKE MODERATOR ŌĆō DR.VIDHYARANI R PRESENTER ŌĆō DR. YUSRA
- 2. INTRODUCTION ŌĆó Stroke - a generic term meaning sudden onset of a neurologic event and is also referred to as a cerebrovascular accident (CVA).
- 3. CAUSES ŌĆó ASCO phenotypic system - which divides strokes into four subtypes: Atherosclerotic Small vessel disease Cardioembolic Others ŌĆó Hemorrhagic Spontaneous intracranial hemorrhage Non traumatic SAH Venous occlusions
- 4. HYPERACUTE STAGE : < 6 HOURS ŌĆó ADC maps may depict darkening within minutes of stroke onset and are more sensitive than diffusion-weighted sequences that are performed after a stroke, which demonstrate hyperintensity.
- 6. ACUTE STAGE: 12ŌĆō24 Hours ŌĆó There are further increases in the cytotoxic edema and intracellular Ca2+. ŌĆó Activation of a wide range of enzyme systems and production of oxygen-free radicals lead to damage of cell membranes, DNA, and structural neuronal proteins ultimately leading to cell death.
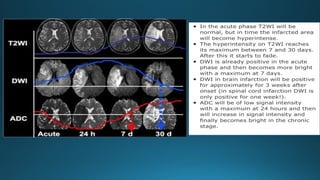
- 7. ŌĆó Cerebral edema results in prolongation of T1 and T2 relaxation times on MRI. T2 changes (seen after 6ŌĆō8 hours) are more sensitive than T1. ŌĆó By 24 hours, 90% of patients show changes on T2-WI and only 50% show changes on T1-WI. ŌĆó Cerebral edema results in effacement of convexity sulci and mild swelling of the gyri without mass effect.
- 8. ŌĆó There may be associated subcortical hypointensity on T2 WI, which is due to free radicals sludging of deoxygenated RBC. In addition, thrombus may be seen as hyperintensity within the vessel lumen (loss of normal signal void).
- 11. SUBACUTE STAGE: 2 DAYSŌĆō2 WEEKS ŌĆó There is breakdown in the BBB and rupture of swollen cells - vasogenic edema. ŌĆó This takes about 18ŌĆō24 hours to develop and becomes maximum by 48ŌĆō72 hours. ŌĆó In this phase, imaging shows increased edema, mass effect, and possible herniation depending on the size and site of the infarct.
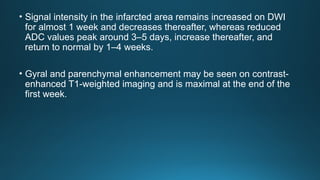
- 12. ŌĆó Signal intensity in the infarcted area remains increased on DWI for almost 1 week and decreases thereafter, whereas reduced ADC values peak around 3ŌĆō5 days, increase thereafter, and return to normal by 1ŌĆō4 weeks. ŌĆó Gyral and parenchymal enhancement may be seen on contrast- enhanced T1-weighted imaging and is maximal at the end of the first week.
- 15. CHRONIC STAGE: 2 WEEKSŌĆō2 MONTHS ŌĆó The chronic stage begins with restoration of the BBB, resolution of vasogenic edema, and cleaning up of necrotic tissue. ŌĆó This phase is characterized by local brain atrophy, gliosis, cavity formation, and ex vacuo dilatation of the adjacent ventricle. ŌĆó Calcification and deposition of blood products (hemosiderin) may be seen on T2 and GRE sequences.
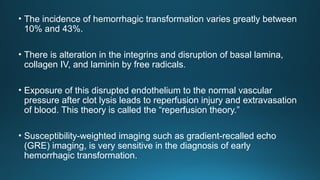
- 16. ŌĆó The incidence of hemorrhagic transformation varies greatly between 10% and 43%. ŌĆó There is alteration in the integrins and disruption of basal lamina, collagen IV, and laminin by free radicals. ŌĆó Exposure of this disrupted endothelium to the normal vascular pressure after clot lysis leads to reperfusion injury and extravasation of blood. This theory is called the ŌĆ£reperfusion theory.ŌĆØ ŌĆó Susceptibility-weighted imaging such as gradient-recalled echo (GRE) imaging, is very sensitive in the diagnosis of early hemorrhagic transformation.
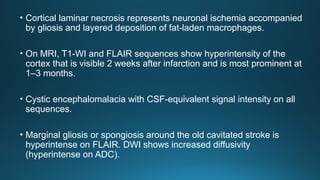
- 17. ŌĆó Cortical laminar necrosis represents neuronal ischemia accompanied by gliosis and layered deposition of fat-laden macrophages. ŌĆó On MRI, T1-WI and FLAIR sequences show hyperintensity of the cortex that is visible 2 weeks after infarction and is most prominent at 1ŌĆō3 months. ŌĆó Cystic encephalomalacia with CSF-equivalent signal intensity on all sequences. ŌĆó Marginal gliosis or spongiosis around the old cavitated stroke is hyperintense on FLAIR. DWI shows increased diffusivity (hyperintense on ADC).
- 20. GRADIENT-ECHO AND SUSCEPTIBILITY-WEIGHTED IMAGING ŌĆó Hemorrhagic Transformation - Gradient-echo and susceptibility- weighted sequences are the most sensitive sequences. ŌĆó It is a spectrum of findings ranging from small petechial areas of microbleeding to large parenchymal hematoma. ŌĆó These areas of bleeding are thought to be secondary to diapedesis of red blood cells across a leaky and damaged blood-brain barrier. This theory is called the ŌĆ£reperfusion theory.ŌĆØ
- 22. ŌĆó Cortical and Pseudolaminar Necrosis - cause serpiginous cortical T1 shortening, which is not caused by calcium or hemoglobin products; rather, it presumably results from some other unknown substance or paramagnetic material, possibly lipid-laden macrophages. ŌĆó High cortical signal intensity may be seen on T1-WI, 3ŌĆō5 days after stroke and in many cases it is seen about 2 weeks after stroke. ŌĆó It increases in intensity and fades after about 3 months but in some cases, it may persist for more than a year.
- 23. ŌĆó The pattern of contrast enhancement may help determine the age of the stroke. ŌĆó In ischemic stroke, enhancement may be arterial, meningeal, or parenchymal. ŌĆó Arterial enhancement, the ŌĆ£intravascular enhancementŌĆØ sign, usually occurs first and may be seen as early as 0ŌĆō2 hours after onset of stroke. POST CONTRAST
- 24. ŌĆó It fades about 1 week after stroke, around that time parenchymal enhancement begins and after complete infarction. ŌĆó Arterial enhancement occurs in about 50% of patients with ischemic stroke and is most commonly seen 3 days after onset of symptoms. ŌĆó Meningeal enhancement is the rarest type of enhancement. It occurs within the first week after onset of stroke, usually 2ŌĆō6 days, with a peak on days 1ŌĆō3. ŌĆó It usually occurs only after a large infarct in the adjacent meninges and is thought to be secondary to reactive hyperemia.
- 25. ŌĆó Parenchymal enhancement may be further subdivided into early and late enhancement. ŌĆó It commonly begins 5ŌĆō7 days after complete infarction, around the time arterial and meningeal enhancement fades. ŌĆó In most infarcts, parenchymal enhancement is seen between 1 week and 2 months after stroke.
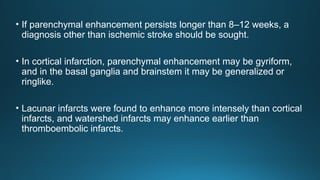
- 27. ŌĆó If parenchymal enhancement persists longer than 8ŌĆō12 weeks, a diagnosis other than ischemic stroke should be sought. ŌĆó In cortical infarction, parenchymal enhancement may be gyriform, and in the basal ganglia and brainstem it may be generalized or ringlike. ŌĆó Lacunar infarcts were found to enhance more intensely than cortical infarcts, and watershed infarcts may enhance earlier than thromboembolic infarcts.
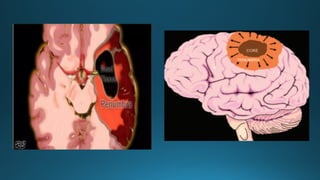
- 28. PENUMBRA ŌĆó Acute cerebral ischemia may result in a central irreversibly infarcted tissue core surrounded by a peripheral region of stunned cells that is called a penumbra. ŌĆó Brain tissue is exquisitely sensitive to ischemia, because of the absence of neuronal energy stores.
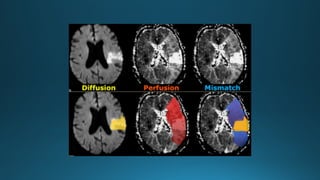
- 31. PERFUSION MRI ŌĆó Restriction on DWI generally reflects the densely ischemic core of the infarct while PMR depicts the surrounding ŌĆ£at riskŌĆØ - penumbra. ŌĆó A DWI-PWI mismatch is one of the criteria for determining suitability for intraarterial thrombolysis.
- 36. WATERSHED ("BORDER ZONE") INFARCTS ŌĆó Internal WS Infarcts - Internal "border zone" infarcts can be confluent or partial. ŌĆó Confluent infarcts are large, cigar-shaped lesions that lie alongside or just above the lateral ventricles. ŌĆó Partial infarcts are more discrete, rosary-like lesions. They resemble a line of beads extending from front to back in the deep white matter.
- 37. ŌĆó Stenosis or occlusion of the ipsilateral internal carotid artery or MCA is common with unilateral lesions. ŌĆó The presence and degree of hemodynamic impairment can be determined using a number of methods, including pCT, pMR, SPECT, and PET. ŌĆó External (Cortical) WS Infarcts - Cortical (external) WS infarcts are wedge or gyriform shaped.
- 40. CURRENT THROMBOLYTIC AND NEUROINTERVENTIONAL TECHNIQUES ŌĆó Catheter-directed Intraarterial Thrombolysis ŌĆó Embolectomy and Mechanical Disruption Devices ŌĆó Intracranial Angioplasty and Stenting
- 42. THANK YOU
Editor's Notes
- #4: *Based on timings, stroke is divided into hyperacute, acute, subacute and chronic stages.
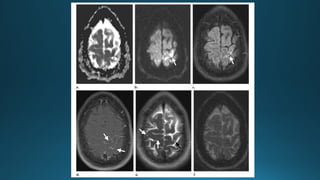
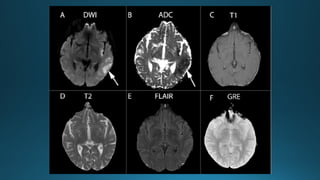
- #5: Early hyperacute stroke (a, b) ADC map (a) and diffusion-weighted MR image (b) show an area of restricted diffusion in the left motor cortex (arrow). (c) FLAIR image shows a corresponding area of slightly high signal intensity (arrow). (d) Gadolinium-based contrastenhanced T1-weighted MR image shows arterial enhancement (arrows). No parenchymal enhancement is seen. (e) T2- weighted MR image shows an area of high signal intensity in the left motor cortex (black arrow). Other scattered nonspecific subcortical areas of high signal intensity are also seen (white arrows), confounding the finding of late hyperacute stroke. (f) No hemorrhagic transformation is seen at susceptibility-weighted MR imaging. Because of the presence of early arterial enhancement and only slightly high signal intensity at FLAIR imaging, the stroke is likely less than 6 hours old (early hyperacute).
- #9: Acute stroke
- #10: Comprehensive MRI assessment in acute stroke using DWI, PWI and MR angiography. images depict an acute ischaemic infarct (white arrows), which is visible only in A , the diffusion-weighted imaging (DWI); B , the apparent diffusion coefficient map (ADC);╠²
- #13: Subacute stroke T2 fogging effect - Intensity decreases with time. Gradually becomes isointense at 1-2 weeks. Psuedonormalization/t2 shine through - reverses to become hypointense on DWI and hyperintense with T2 "shine-through" on ADC.
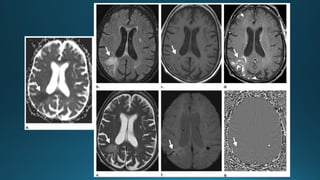
- #14: Early subacute stroke (a) ADC map shows an area of low signal intensity in the right parietooccipital junction (arrow), a finding that usually persists for about 1 week. This area demonstrates high signal intensity at diffusion-weighted imaging (not shown). (b) FLAIR MR image shows a corresponding area of high signal intensity (arrow). (c) T1- weighted MR image shows a corresponding area of low signal intensity (arrow). (d) Gadolinium-based contrast-enhanced T1-weighted MR image shows parenchymal enhancement in the affected area (arrow). Parenchymal enhancement is usually seen about 1 week after stroke. (e) T2-weighted MR image shows a corresponding area of high signal intensity (arrow). (f, g) Susceptibility-weighted minimum intensity projection (f) and susceptibility-weighted phase (g) MR images show early blood products (arrow) indicative of hemorrhagic transformation. These findings are indicative of an early subacute stroke, likely around 7ŌĆō10 days old.
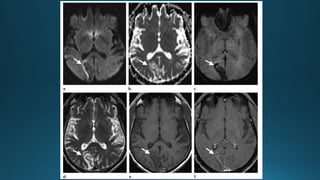
- #18: Chronic stroke . (a) Diffusion-weighted MR image shows an area of low signal intensity in the right occipital lobe (arrow) with a peripheral rim of high signal intensity, a finding that may be due to T2 shine-through. (b) ADC map shows a corresponding area of high signal intensity (arrow). (c) Susceptibilityweighted MR image shows hemorrhagic products (arrow) in the right occipital lobe. (d) T2-weighted MR image shows an area of high signal intensity in the right occipital lobe (arrow). (e) T1-weighted MR image shows a corresponding area of low signal intensity (arrow). (f) Contrast-enhanced T1-weighted MR image shows a corresponding area of parenchymal enhancement (arrow). These findings are indicative of a chronic stroke that is likely 3 weeks to 2 months old.
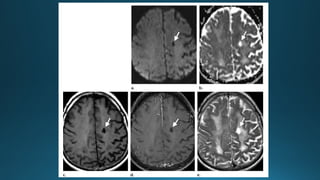
- #19: Chronic lacunar stroke. (a) Diffusion-weighted MR image shows an area of low signal intensity in the left centrum semiovale (arrow). (b) ADC map shows an area of high signal intensity in the left centrum semiovale (arrow). (c) Unenhanced T1-weighted MR image shows an area of low signal intensity in the left centrum semiovale (arrow). (d) Gadolinium-based contrastenhanced T1-weighted MR image shows an area of contrast enhancement in the left centrum semiovale (arrow). (e) T2-weighted MR image shows an area of high signal intensity in the left centrum semiovale (arrow). These findings are consistent with a chronic lacunar stroke with resultant cystic encephalomalacia
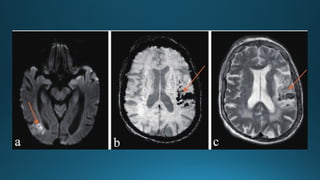
- #21: (a) DWI image of ischemic stroke with hemorrhagic transformation. (b) SWI image of ischemic stroke with hemorrhagic transformation. (c) T2 image of ischemic stroke with hemorrhagic transformation.
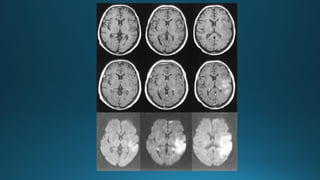
- #26: Top row,╠²Unenhanced T1-weighted images (600/14/1) show progressing low signal mass effect of the infarcted tissue. Middle row,╠²Contrast-enhanced T1-weighted images (600/14/1) show intravascular enhancement over the infarct on the first and second days and moderate cortical and subcortical enhancement 1 week after stroke. Bottom row,╠²Diffusion-weighted trace images (4000/103/1, in raw image acquisition) show the extent of infarcted tissue as areas of increased signal intensity (bright) in the territory of the left middle cerebral artery.
- #29: This is the image showing a central black area which is the dead tissue with irreversible changes, whereas the surrounding red area depicts the tissue at risk or viable tissue which is called penumbra. This area can be saved with timely thrombolytic therapy.
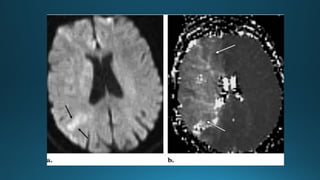
- #30: Acute stroke in a 67-year-old woman with acute left hemiplegia 2 hours after carotid endarterectomy. (a) Diffusion-weighted MR image (b 1000 sec/mm2) shows an area of mildly increased signal intensity in the right parietal lobe (arrows). The ADC values in this region were decreased. (b) Perfusion-weighted MR image shows a larger area with increased time to peak enhancement (arrows) in the right cerebral hemisphere. The mismatch between the perfusion and diffusion images is indicative of a large penumbra
- #32: The fisrt diffusion image indicates the yellow area with irreversible changes (dead tissue). In the middle there is a larger red area with hypoperfusion. the third image shows diffusion-perfusion mismatch which is indicated in blue. This is the tissue at risk that can be saved with therapy.
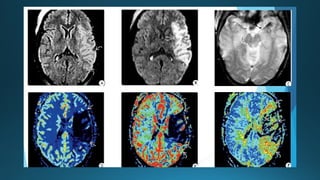
- #33: FLAIR shows left MCA cortical hyperintensity with intravascular signal in the M3, M4 branches. diffusion restriction in insular cortex and external capsule with minimal involvement of the lateral putamen. "blooming" thrombus in the left M1 segment on GRE. pMR shows markedly reduced cerebral blood flow in the densely ischemic core infarct, which appears smaller than the corresponding DWI and FLAIR abnormality. CBV is markedly reduced in the densely ischemic core infarct, but penumbra has well maintained CBV in the adjacent brain. Mean transit time shows the prolonged transit time in the large ischemic penumbra as well as some islands of slowed but still-perfused brain within the core infarct.
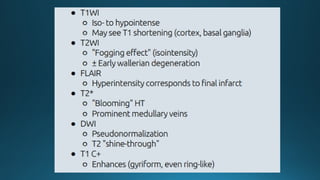
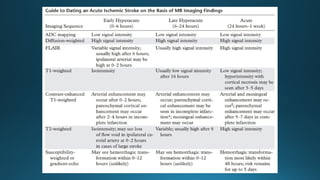
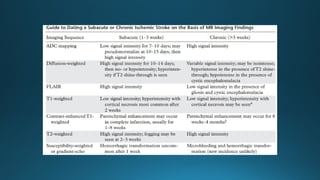
- #34: This is a table summarizing the mri findings of different stages of stroke
- #37: SPECT ŌĆō Single photon emission CT
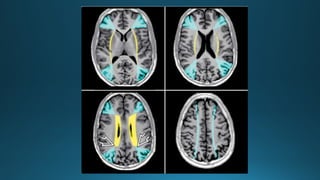
- #38: T1-weighted images show two vascular watershed (WS) zones with external (cortical) WS zones in blue color. Wedge-shaped areas between the ACAs, MCAs, and PCAs represent "border zones" between the three major terminal vascular distributions. Curved blue lines (lower right) represent subcortical WS zones. The triple "border zones" ’¼ć represent confluence of all three major vessels. Yellow lines indicate the internal (deep WM) WS zone between perforating arteries and major territorial vessels
- #39: To summarise the findings
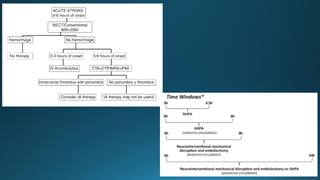
- #41: This is a flowchart depicting the algorithm for stroke IA-intra-arterial