Mulla - Ravine Erosion Assessment
- 1. David Mulla Professor and W. E. Larson Chair in Soil and Water Resources and Shannon Wing, Joel Nelson, Jake Galzki, Wenyu Wang Dept. Soil, Water & Climate University of Minnesota
- 2. WikipediaĪ»s Definition of a Ravine A ravine is a very small valley, which is often the product of stream cutting erosion. Ravines are typically larger in scale than gullies, although smaller than valleys. A ravine is generally a sloping landform of relatively steep (cross-sectional )sides in gradient. Ravines may or may not have active streams flowing along their channel, more often they are characterized by intermittent streams, since their geographical scale may not be sufficiently large to support a perennial watercourse.
- 4. Ravine Impacts on Sedimentation The Minnesota River Basin generates a disproportionately high amount of total suspended sediments to the Upper Mississippi River Basin. Many reaches in the Minnesota River Basin have impaired water quality due to turbidity. The primary sources of sediment in the Minnesota River Basin include stream bluff slumping, upland erosion from agricultural land, stream bank erosion, and down cutting of ravines. No research has been conducted to estimate the frequency or characteristics of ravines or quantify sediment contributions to the Minnesota River Basin from ravines.
- 5. Objectives Use terrain analysis to identify and characterize ravines Compare ravines delineated with LiDAR to those delineated with 30 m DEMs Develop GIS algorithm to automatically delineate ravines, determine their morphological characteristics and estimate their areal coverage
- 6. Le Sueur Cobb Maple 0 5000m
- 7. 0 5000m Le Sueur Cobb Maple
- 8. Le Sueur 0 2500m
- 9. Le Sueur 0 2500m
- 10. Cobb 0 1500m
- 11. Cobb 0 1500m
- 12. 3 m LiDAR Cobb 0 1500m 30m Area: 4.634 ha 3m Area: 2.596 ha
- 13. 30 m DEM Cobb 0 300m
- 14. 30 m DEM Cobb 30m Area: 2.34 ha 0 300m
- 15. 30 m DEM Cobb 30m Area: 3.89 ha 0 300m
- 16. 30 m DEM Cobb 30m Area: 5.92 ha 0 300m
- 17. 30 m DEM Cobb 30m Area: 2.34 ha 30m Area: 3.89 ha 30m Area: 5.92 ha 0 300m
- 18. 3 m LiDAR Cobb 0 300m
- 19. 0 300m 3m Area: 1.995 ha 30m Area: 2.34 ha 30m Area: 3.89 ha 30m Area: 5.92 ha
- 20. Manually digitized area comparison between 30m DEM and 3m LiDAR datasets Digitizing from 30m DEM results in 144% overestimation in ravine area relative to 3m LiDAR Ravine 30m DEM Area 3m LiDAR Area Area Difference 30m - 3m Percent Change ID? (m 2 ) (m 2 ) (m 2 ) (%) 3 38069 17033 21036 123 4 31562 13197 18365 139 5 26130 5189 20941 404 6 134098 78646 55452 71 7 28271 15022 13249 88 8 9941 4051 5890 145 9 27641 9880 17761 180 10 403664 259619 144045 55 11 37484 38900 17535 88 ? ? ? Average 144 ? ? Standard Deviation 105
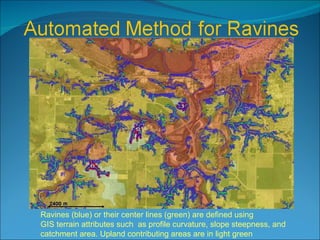
- 21. Automated Methodology for Identifying Ravines in ArcGIS Slope threshold Slopes greater than 7% Standard deviation of aspect >40% Specific Catchment Area threshold Between 200 and 7400 cells
- 22. Ravines (blue) or their center lines (green) are defined using GIS terrain attributes such as profile curvature, slope steepness, and catchment area. Upland contributing areas are in light green
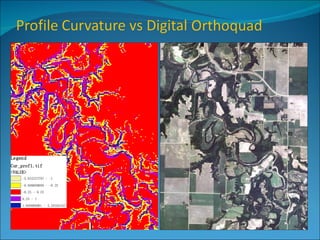
- 23. ?
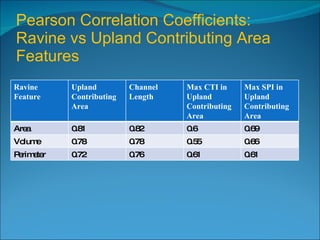
- 24. Pearson Correlation Coefficients: Ravine vs Upland Contributing Area Features Ravine Feature Upland Contributing Area Channel Length Max CTI in Upland Contributing Area Max SPI in Upland Contributing Area Area 0.81 0.82 0.6 0.69 Volume 0.78 0.78 0.55 0.66 Perimeter 0.72 0.76 0.61 0.61
- 25. ?
- 26. ?
- 27. ?
- 28. Minnesota River Ravines and Bluffs *Ravine and bluff areas are expressed as a percent of the total area of ravines or bluffs. Total area of ravines is roughly 80 times greater than total area of bluffs Watershed Area (km 2 ) Ravines (%)* Bluffs (%)* Le Sueur 2881 2.9 41.8 Blue Earth 4015 3.6 26.6 Cottonwood 3400 5.9 8.9 Watonwan 2273 1.3 4.6 Chippewa 5371 5.2 0.4 Redwood 1826 2.1 0.8 Hawk-Yellow 5373 7.5 6.3 Lac Qui Parle 2841 5.6 5.5 Lower 4714 22.9 3.4 Middle 3490 14.4 1.7 Upper 5341 28.6 0
- 29. Conclusions LiDAR based DEMs, relative to standard 30 m DEMs, provide improved accuracy in identifying ravines and estimating attributes (area, gradient, etc) that influence sediment production An automated method has been developed to extract ravine locations and characteristics from LiDAR based and 30 m DEMs Ravines are very common in watersheds adjacent to the Minnesota River Valley channel Other factors such as the proximity of ravines to the Minnesota River Valley channel probably affect the delivery of sediment from ravines
Editor's Notes
- #7: At this scale, the difference between the 2 resolutions is not as visible
- #9: As we scale in, the coarseness starts to rear its ugly headĪŁ
- #11: Even closer, this is a somewhat conservative (area-wise) hand-digitized ravine boundary for a ravine on the Cobb
- #12: But as you can see, with the LiDAR, it is clearly an overestimation of the area
- #13: These are the areas for comparison. The 30m was digitized from the DEM, the 3m was digitized from the LiDAR
- #14: The coarse resolution makes it difficult to define the ravine boundary. What follows are 3 examples of how this ravine boundary might be delineated from conservative to generousĪŁ
- #15: 3 possible boundaries are illustrated: area 23,400 m^2 ©C The most conservative
- #16: 38,900 m^2
- #17: Area = 59,214 m^2
- #18: Noting the variance between the 30m areasĪŁ
- #19: The 3m LiDAR shows a much more accurate boundary
- #20: And results in an area which is (most likely) closest to truth. When compared with the orthoquad, the black boundary shown here is almost exactly aligned.

