NBCC_Presentation_19.05.2016
0 likes65 views
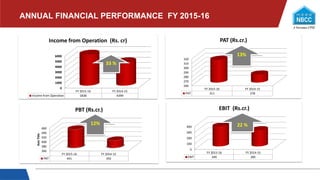
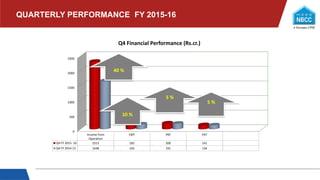
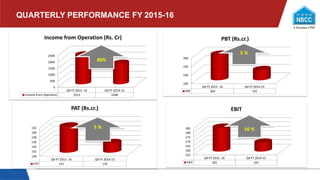
The document summarizes the annual and quarterly financial performance of a company for fiscal years 2015-16 and 2014-15. For annual performance, income from operations increased 33% to Rs. 5838 cr in 2015-16 from Rs. 4399 cr in 2014-15. Similarly, EBIT increased 22% to Rs. 349 cr, PBT increased 12% to Rs. 441 cr, and PAT increased 13% to Rs. 311 cr. For quarterly performance, income from operations in Q4 2015-16 increased 40% to Rs. 2313 cr from Rs. 1648 cr in Q4 2014-15, while EBIT increased 10%, PBT increased 5%, and PAT increased 5%.
1 of 19
Download to read offline






Ad
Recommended
Biz Online Insights: RWC2015 opening weekend
Biz Online Insights: RWC2015 opening weekendBizcommunity
╠²
This document summarizes the results of a 300 person survey conducted over 3 days regarding viewership of and opinions on the 2015 Rugby World Cup. The survey found that 63% of respondents watched all games played so far, while 12% only watched South Africa vs. Japan and 27% watched the opening ceremony. 31% of respondents rated the Springboks' performance as outstanding, 23% as good, and 19% said they didn't know. Ratings varied slightly between gender, age, and geographic subgroups.Pagos de moto
Pagos de motoosman joel pav├│n rodriguen
╠²
This document shows the payment schedule for a motorcycle with an original sale price of 20,000. Payments of 1,000 are due on the 15th and last day of each month, with the balance decreasing by 1,000 each time until fully paid off. As of February 29th, 5 payments totaling 5,000 have been made, leaving a remaining balance of 15,000.Site G charts
Site G chartsLaurenLHenley
╠²
The document contains three charts showing metrics for Site G's mobile traffic over multiple years: page views from mobile traffic increased from 2013 to 2014; sessions from mobile traffic also increased from 2013 to 2014; the percentage of total traffic from mobile sources increased from 2013 to 2014, rising from around 15% to over 30%.Ashok leyland sales figures september 2016
Ashok leyland sales figures september 2016MotorCruze
╠²
Sales figures for September 2016 showed a 26% decrease in medium and heavy commercial vehicle (M&HCV) sales compared to September 2015, while light commercial vehicle (LCV) sales rose 17%. For the six month period of April to September 2016, total vehicle sales were down 1% compared to the same period in 2015, with M&HCV sales down 4% and LCV sales up 7%.Reliance Industries Growth for the Year 2017-2018 y-o-y analysis
Reliance Industries Growth for the Year 2017-2018 y-o-y analysisManoj Kurup
╠²
Mukesh Ambani is the chairman and managing director of Reliance Industries Limited, an Indian conglomerate. The document provides financial information about Reliance Industries, including yearly and quarterly turnover and profit figures from 2014 to 2019 which show consistent growth. It also charts the increasing share price of Reliance Industries over this period and lists some key events and acquisitions and the expansion of its businesses in areas such as petrochemicals, retail, and digital services. Finally, it mentions that Ambani sees the coming decade as a 'Golden Decade Next' for the company's future growth.Gwyneth video
Gwyneth videoDonna Matthews
╠²
I will be moving to a new home at 260 Milroy Drive in Peterborough, Ontario in July 2015. The address of the home is 260 Milroy Drive in Peterborough, Ontario. I am moving to this new home located at 260 Milroy Drive in Peterborough, Ontario in July 2015.Karnataka PGCET Electronics & Communication 2015 Answer Key
Karnataka PGCET Electronics & Communication 2015 Answer KeyEneutron
╠²
This document appears to be an exam answer key for the PGCET 2015 exam administered by the Karnataka Examinations Authority. It lists the question numbers from 1 to 75 and provides the corresponding answer for each question, identified by a number from 1 to 4 or the letter G. This contains the answer key information necessary to grade exam responses for the PGCET 2015 exam.Flujo positivo
Flujo positivoVelarde Sussoni Consultores
╠²
The document shows cash flow data over 5 months, including production units, sales price, total sales, income from sales and collections, expenses including materials, labor, utilities, taxes, and loans. It calculates the monthly cash flow and ending balance. Production remained steady at 1000-1500 units per month while price increased slightly. Sales generated $320,000-$345,000 per month. Expenses averaged around $230,000-$250,000 per month, resulting in a positive and increasing cash balance each month, showing strong and consistent cash flow.Karadeniz hazelnut
Karadeniz hazelnutYunus Ûztürk
╠²
This document summarizes Karadeniz Hazelnut, the oldest hazelnut integrated facility in Turkey established in 1967. It exports a wide range of hazelnut products including shelled hazelnuts, kernels, and pastes to countries in Europe, North America, Asia, Africa, and is a major supplier to the global chocolate and cake industries. Hazelnut processing and trade is its core business.Yns,
Yns,Yunus Ûztürk
╠²
This document discusses computer ethics and defines some basic concepts. It provides an overview of what ethics means, the origins of computer ethics dating back to 1950, and some key aspects of copyright. It also lists 6 basic rules of computer ethics, including not stealing or harming others, accessing files without permission, using others' computer resources without permission, and copying copyrighted software without authorization.A journey to stock market
A journey to stock market Abhinav Jain
╠²
The document provides an overview of the stock market, including its types, basic requirements for trading, and trading styles such as intraday and positional trading. It explains concepts like short selling, fundamental and technical analysis, and describes the characteristics of bull and bear markets. Additionally, it highlights the importance of the stock market in economic growth and investment opportunities.ÓĖüÓĖ▓ÓĖŻÓ╣ĆÓĖŻÓĖĄÓĖóÓĖüÓĖŖÓĖĘÓ╣łÓĖŁÓĖŖÓĖ┤Ó╣ēÓĖÖÓĖ¬Ó╣łÓĖ¦ÓĖÖÓĖĢÓ╣łÓĖ▓ÓĖćÓ╣åÓŠ║ÓĖŁÓĖćÓĖłÓĖ▒ÓĖüÓĖŻ
ÓĖüÓĖ▓ÓĖŻÓ╣ĆÓĖŻÓĖĄÓĖóÓĖüÓĖŖÓĖĘÓ╣łÓĖŁÓĖŖÓĖ┤Ó╣ēÓĖÖÓĖ¬Ó╣łÓĖ¦ÓĖÖÓĖĢÓ╣łÓĖ▓ÓĖćÓ╣åÓŠ║ÓĖŁÓĖćÓĖłÓĖ▒ÓĖüÓĖŻSueepsagul Jannak
╠²
Fdp
Fdpkamya guglani
╠²
This document summarizes cell phone cloning, which involves copying the identity of one cell phone to another in order to make fraudulent calls. It discusses how cloning works for GSM and CDMA networks and important related terms like IMEI, ESN, and MIN. The document outlines how phones are cloned by discovering the ESN/MIN or IMEI/MIN pair, usually by sniffing cellular networks or hacking companies. It then describes some methods networks use to detect cloned phones, like duplicate detection when multiple phones appear in the same place, velocity traps when impossible travel is detected, and usage profiling for discrepancies. Finally, it discusses ways for users and networks to help prevent cloning through PIN codes, traffic analysis software,Sisa╠łlto╠łmarkkinoinnin trendit Suomessa 2016
Sisa╠łlto╠łmarkkinoinnin trendit Suomessa 2016Kubo Finland
╠²
Sis├żlt├Čmarkkinoinnin trendit Suomessa 2016 -tutkimuksen raporttiKaradeniz Hazelnut
Karadeniz HazelnutYunus Ûztürk
╠²
Karadeniz Hazelnut is the oldest hazelnut integrated facility in Turkey, established in 1967. They export a variety of hazelnut products including shelled hazelnuts, kernels, and pastes to countries in Europe, North America, Asia, Africa, and supply the ice cream, cake, and chocolate industries globally. As the first patented integrated hazelnut facility in Turkey, hazelnuts are their core business.Excel Model for Valuation of Natural Gas Firm
Excel Model for Valuation of Natural Gas FirmFlevy.com Best Practices
╠²
The document provides financial projections and performance metrics for a company from FY2010 to FY2013, detailing net sales, profit after tax (PAT), earnings per share (EPS), and various financial ratios. Key figures show expected growth in net sales from approximately Rs. 10,649.1 crore in FY2010 to Rs. 23,587.9 crore in FY2013, alongside an increase in PAT from Rs. 404.5 crore to Rs. 1,077.9 crore. Additional metrics include EBITDA, debt-to-equity ratio, and return on equity (ROE), indicating a solid financial outlook over the period.NTPC Financial Modelling
NTPC Financial ModellingSHAHID HASSAN
╠²
This document presents a comprehensive financial analysis of NTPC, including detailed balance sheets and profit and loss statements over various years. Key financial figures such as total liabilities, net worth, income turnover, and net profit are outlined, demonstrating the company's financial progression and stability. The data spans multiple fiscal years, highlighting trends in revenue, expenses, and earnings per share.NTPC Financial Modelling
NTPC Financial ModellingShreya Banerjee
╠²
The document presents a financial analysis of NTPC Company over several years, detailing balance sheets, profit and loss statements, and financial metrics. Key figures include total assets, liabilities, income, expenses, and net profit, reflecting the company's economic performance and stability. The analysis covers multiple fiscal years, providing insights into trends and financial health.Excel Model of Trading Firm
Excel Model of Trading FirmFlevy.com Best Practices
╠²
The document presents financial projections for a company over the fiscal years 2014 to 2017, detailing net sales, earnings per share (EPS), total expenditure, dividend paid, and various financial ratios. It highlights trends in net sales growth, EBITDA margins, and return on equity, suggesting a positive financial outlook. Additionally, it includes historical and projected data on expenses, profits, and cash flows.SIC 5143 Line ofBusinessDairy products, except dried.docx
SIC 5143 Line ofBusinessDairy products, except dried.docxbudabrooks46239
╠²
The document presents financial metrics for the dairy products industry excluding dried or canned items, spanning from 2009 to 2012, examining solvency, efficiency, and profitability ratios. Key financial indicators include ratios such as quick ratio, current ratio, return on assets, and net profit margins, illustrating trends over the years. Additionally, it includes detailed annual financials, highlighting income statements, balance sheets, and cash flow statements in millions of US dollars.Valuation Of Maruti Suzuki
Valuation Of Maruti SuzukiAakash Singh
╠²
- The document provides financial data for Maruti Suzuki from March 2008 to the estimated March 2020, including revenues, expenses, profits, assets, liabilities, and other financial metrics.
- It shows steady annual revenue growth for Maruti Suzuki over this period, from around Rs. 18 billion in 2008 to an estimated Rs. 1,242.99 billion in 2020, with expenses also increasing but remaining a high percentage of total revenues.
- Profits have also increased substantially over time, with the net profit estimated at Rs. 161.58 billion for fiscal year ending March 2020, up significantly from Rs. 1,218.70 billion in 2008.Valuation Of Maruti Suzuki
Valuation Of Maruti SuzukiAakash Singh
╠²
- The document provides financial data for Maruti Suzuki from March 2008 to the estimated March 2020, including revenues, expenses, profits, assets, liabilities, and other financial metrics.
- It shows steady annual revenue growth for Maruti Suzuki over this period, from around Rs. 18 billion in 2008 to an estimated Rs. 1,242.99 billion in 2020, with expenses also increasing but remaining a high percentage of total revenues.
- Profits have also increased substantially over time, with the net profit estimated at Rs. 161.58 billion for fiscal year ending March 2020, up significantly from Rs. 1,218.70 billion in 2008.Valuation Of ASHOK LEYLAND
Valuation Of ASHOK LEYLANDAakash Singh
╠²
- Ashok Leyland's total operating revenues increased 45% year-over-year to Rs. 107,035 crore in FY21 from Rs. 73,817 crore in FY20. Total expenses also increased 44% to Rs. 103,824 crore in FY21 from Rs. 72,341 crore in FY20.
- EBITDA more than doubled to Rs. 4,253 crore in FY21 from Rs. 2,377 crore in FY20, with the EBITDA margin expanding to 4% from 3%.
- Net profit for the year increased 24% to Rs. 6,422 crore in FY21 from Rs. 5AFS-Biafo Industies.pptx
AFS-Biafo Industies.pptxMUHAMMADBILAL1751
╠²
This document provides an analysis of Biafo Industries Limited, including:
- An overview of the company's history, products, vision, mission, and facilities.
- Qualitative analyses of the company's management, competitive positioning, product quality, safety, environmental responsibility, customer satisfaction, distribution network, and brand reputation.
- A SWOT analysis identifying strengths such as a strong market position and experienced management team, and weaknesses like limited geographic reach and reliance on a single product.
- Risk factors including product liability, operational risks, financial risks, regulatory risks, competitive risks, and geopolitical risks.
- Ratio analyses including growth, profitability, activity, liquidity, solvencyMA PRESENTATION FOR COLLEGE VERY IMP.pptx
MA PRESENTATION FOR COLLEGE VERY IMP.pptxsamyakpatwa
╠²
1. The document analyzes trends in the financial statements of PNB Housing Finance Limited over three years from March 2021 to March 2023.
2. Key trends identified include steady growth in net revenue from operations, fluctuations in other income, impact of expenses on profitability, and changes in tax expenses affecting profit.
3. The analysis of balance sheet trends shows increasing shareholder funds, declining long-term borrowings but rising short-term borrowings, and fluctuations in asset composition with higher current assets.
4. Overall, the company demonstrates positive financial performance and future projections include continued growth in equity, stabilization of debt levels, and enhanced liquidity to support expansion.Neslte India Ltd_Financial Model Working.pdf
Neslte India Ltd_Financial Model Working.pdfDeepakKumar234566
╠²
This document contains financial statements and analysis for a company over several years:
1) Income statements, balance sheets, cash flow statements and key financial ratios are presented for years 2018-2025 with actual data for 2018-2021 and estimates for 2022-2025.
2) The income statement shows steady revenue growth of 10% per year along with trends in expenses, profits and tax rates.
3) The balance sheet outlines asset and liability accounts with growth assumptions. Major assets include property/equipment, investments and current assets.
4) Cash flow statements show cash from operations exceeding cash used in investing and financing activities, resulting in positive cash flow overall.Valuation of Indian hospitality industry
Valuation of Indian hospitality industryShivani Chaluvadi
╠²
The document provides a comprehensive financial analysis of various Indian hospitality companies, detailing their income statements, expenses, and balance sheets from March 2006 to March 2016. It includes key figures such as revenue growth, profit after tax, and asset values, along with various financial ratios and metrics. Additionally, it looks at projected growth rates and market valuation of the industry, emphasizing the overall growth trajectory of the Indian hospitality sector.More Related Content
Viewers also liked (10)
Karadeniz hazelnut
Karadeniz hazelnutYunus Ûztürk
╠²
This document summarizes Karadeniz Hazelnut, the oldest hazelnut integrated facility in Turkey established in 1967. It exports a wide range of hazelnut products including shelled hazelnuts, kernels, and pastes to countries in Europe, North America, Asia, Africa, and is a major supplier to the global chocolate and cake industries. Hazelnut processing and trade is its core business.Yns,
Yns,Yunus Ûztürk
╠²
This document discusses computer ethics and defines some basic concepts. It provides an overview of what ethics means, the origins of computer ethics dating back to 1950, and some key aspects of copyright. It also lists 6 basic rules of computer ethics, including not stealing or harming others, accessing files without permission, using others' computer resources without permission, and copying copyrighted software without authorization.A journey to stock market
A journey to stock market Abhinav Jain
╠²
The document provides an overview of the stock market, including its types, basic requirements for trading, and trading styles such as intraday and positional trading. It explains concepts like short selling, fundamental and technical analysis, and describes the characteristics of bull and bear markets. Additionally, it highlights the importance of the stock market in economic growth and investment opportunities.ÓĖüÓĖ▓ÓĖŻÓ╣ĆÓĖŻÓĖĄÓĖóÓĖüÓĖŖÓĖĘÓ╣łÓĖŁÓĖŖÓĖ┤Ó╣ēÓĖÖÓĖ¬Ó╣łÓĖ¦ÓĖÖÓĖĢÓ╣łÓĖ▓ÓĖćÓ╣åÓŠ║ÓĖŁÓĖćÓĖłÓĖ▒ÓĖüÓĖŻ
ÓĖüÓĖ▓ÓĖŻÓ╣ĆÓĖŻÓĖĄÓĖóÓĖüÓĖŖÓĖĘÓ╣łÓĖŁÓĖŖÓĖ┤Ó╣ēÓĖÖÓĖ¬Ó╣łÓĖ¦ÓĖÖÓĖĢÓ╣łÓĖ▓ÓĖćÓ╣åÓŠ║ÓĖŁÓĖćÓĖłÓĖ▒ÓĖüÓĖŻSueepsagul Jannak
╠²
Fdp
Fdpkamya guglani
╠²
This document summarizes cell phone cloning, which involves copying the identity of one cell phone to another in order to make fraudulent calls. It discusses how cloning works for GSM and CDMA networks and important related terms like IMEI, ESN, and MIN. The document outlines how phones are cloned by discovering the ESN/MIN or IMEI/MIN pair, usually by sniffing cellular networks or hacking companies. It then describes some methods networks use to detect cloned phones, like duplicate detection when multiple phones appear in the same place, velocity traps when impossible travel is detected, and usage profiling for discrepancies. Finally, it discusses ways for users and networks to help prevent cloning through PIN codes, traffic analysis software,Sisa╠łlto╠łmarkkinoinnin trendit Suomessa 2016
Sisa╠łlto╠łmarkkinoinnin trendit Suomessa 2016Kubo Finland
╠²
Sis├żlt├Čmarkkinoinnin trendit Suomessa 2016 -tutkimuksen raporttiKaradeniz Hazelnut
Karadeniz HazelnutYunus Ûztürk
╠²
Karadeniz Hazelnut is the oldest hazelnut integrated facility in Turkey, established in 1967. They export a variety of hazelnut products including shelled hazelnuts, kernels, and pastes to countries in Europe, North America, Asia, Africa, and supply the ice cream, cake, and chocolate industries globally. As the first patented integrated hazelnut facility in Turkey, hazelnuts are their core business.ÓĖüÓĖ▓ÓĖŻÓ╣ĆÓĖŻÓĖĄÓĖóÓĖüÓĖŖÓĖĘÓ╣łÓĖŁÓĖŖÓĖ┤Ó╣ēÓĖÖÓĖ¬Ó╣łÓĖ¦ÓĖÖÓĖĢÓ╣łÓĖ▓ÓĖćÓ╣åÓŠ║ÓĖŁÓĖćÓĖłÓĖ▒ÓĖüÓĖŻ
ÓĖüÓĖ▓ÓĖŻÓ╣ĆÓĖŻÓĖĄÓĖóÓĖüÓĖŖÓĖĘÓ╣łÓĖŁÓĖŖÓĖ┤Ó╣ēÓĖÖÓĖ¬Ó╣łÓĖ¦ÓĖÖÓĖĢÓ╣łÓĖ▓ÓĖćÓ╣åÓŠ║ÓĖŁÓĖćÓĖłÓĖ▒ÓĖüÓĖŻSueepsagul Jannak
╠²
Similar to NBCC_Presentation_19.05.2016 (20)
Excel Model for Valuation of Natural Gas Firm
Excel Model for Valuation of Natural Gas FirmFlevy.com Best Practices
╠²
The document provides financial projections and performance metrics for a company from FY2010 to FY2013, detailing net sales, profit after tax (PAT), earnings per share (EPS), and various financial ratios. Key figures show expected growth in net sales from approximately Rs. 10,649.1 crore in FY2010 to Rs. 23,587.9 crore in FY2013, alongside an increase in PAT from Rs. 404.5 crore to Rs. 1,077.9 crore. Additional metrics include EBITDA, debt-to-equity ratio, and return on equity (ROE), indicating a solid financial outlook over the period.NTPC Financial Modelling
NTPC Financial ModellingSHAHID HASSAN
╠²
This document presents a comprehensive financial analysis of NTPC, including detailed balance sheets and profit and loss statements over various years. Key financial figures such as total liabilities, net worth, income turnover, and net profit are outlined, demonstrating the company's financial progression and stability. The data spans multiple fiscal years, highlighting trends in revenue, expenses, and earnings per share.NTPC Financial Modelling
NTPC Financial ModellingShreya Banerjee
╠²
The document presents a financial analysis of NTPC Company over several years, detailing balance sheets, profit and loss statements, and financial metrics. Key figures include total assets, liabilities, income, expenses, and net profit, reflecting the company's economic performance and stability. The analysis covers multiple fiscal years, providing insights into trends and financial health.Excel Model of Trading Firm
Excel Model of Trading FirmFlevy.com Best Practices
╠²
The document presents financial projections for a company over the fiscal years 2014 to 2017, detailing net sales, earnings per share (EPS), total expenditure, dividend paid, and various financial ratios. It highlights trends in net sales growth, EBITDA margins, and return on equity, suggesting a positive financial outlook. Additionally, it includes historical and projected data on expenses, profits, and cash flows.SIC 5143 Line ofBusinessDairy products, except dried.docx
SIC 5143 Line ofBusinessDairy products, except dried.docxbudabrooks46239
╠²
The document presents financial metrics for the dairy products industry excluding dried or canned items, spanning from 2009 to 2012, examining solvency, efficiency, and profitability ratios. Key financial indicators include ratios such as quick ratio, current ratio, return on assets, and net profit margins, illustrating trends over the years. Additionally, it includes detailed annual financials, highlighting income statements, balance sheets, and cash flow statements in millions of US dollars.Valuation Of Maruti Suzuki
Valuation Of Maruti SuzukiAakash Singh
╠²
- The document provides financial data for Maruti Suzuki from March 2008 to the estimated March 2020, including revenues, expenses, profits, assets, liabilities, and other financial metrics.
- It shows steady annual revenue growth for Maruti Suzuki over this period, from around Rs. 18 billion in 2008 to an estimated Rs. 1,242.99 billion in 2020, with expenses also increasing but remaining a high percentage of total revenues.
- Profits have also increased substantially over time, with the net profit estimated at Rs. 161.58 billion for fiscal year ending March 2020, up significantly from Rs. 1,218.70 billion in 2008.Valuation Of Maruti Suzuki
Valuation Of Maruti SuzukiAakash Singh
╠²
- The document provides financial data for Maruti Suzuki from March 2008 to the estimated March 2020, including revenues, expenses, profits, assets, liabilities, and other financial metrics.
- It shows steady annual revenue growth for Maruti Suzuki over this period, from around Rs. 18 billion in 2008 to an estimated Rs. 1,242.99 billion in 2020, with expenses also increasing but remaining a high percentage of total revenues.
- Profits have also increased substantially over time, with the net profit estimated at Rs. 161.58 billion for fiscal year ending March 2020, up significantly from Rs. 1,218.70 billion in 2008.Valuation Of ASHOK LEYLAND
Valuation Of ASHOK LEYLANDAakash Singh
╠²
- Ashok Leyland's total operating revenues increased 45% year-over-year to Rs. 107,035 crore in FY21 from Rs. 73,817 crore in FY20. Total expenses also increased 44% to Rs. 103,824 crore in FY21 from Rs. 72,341 crore in FY20.
- EBITDA more than doubled to Rs. 4,253 crore in FY21 from Rs. 2,377 crore in FY20, with the EBITDA margin expanding to 4% from 3%.
- Net profit for the year increased 24% to Rs. 6,422 crore in FY21 from Rs. 5AFS-Biafo Industies.pptx
AFS-Biafo Industies.pptxMUHAMMADBILAL1751
╠²
This document provides an analysis of Biafo Industries Limited, including:
- An overview of the company's history, products, vision, mission, and facilities.
- Qualitative analyses of the company's management, competitive positioning, product quality, safety, environmental responsibility, customer satisfaction, distribution network, and brand reputation.
- A SWOT analysis identifying strengths such as a strong market position and experienced management team, and weaknesses like limited geographic reach and reliance on a single product.
- Risk factors including product liability, operational risks, financial risks, regulatory risks, competitive risks, and geopolitical risks.
- Ratio analyses including growth, profitability, activity, liquidity, solvencyMA PRESENTATION FOR COLLEGE VERY IMP.pptx
MA PRESENTATION FOR COLLEGE VERY IMP.pptxsamyakpatwa
╠²
1. The document analyzes trends in the financial statements of PNB Housing Finance Limited over three years from March 2021 to March 2023.
2. Key trends identified include steady growth in net revenue from operations, fluctuations in other income, impact of expenses on profitability, and changes in tax expenses affecting profit.
3. The analysis of balance sheet trends shows increasing shareholder funds, declining long-term borrowings but rising short-term borrowings, and fluctuations in asset composition with higher current assets.
4. Overall, the company demonstrates positive financial performance and future projections include continued growth in equity, stabilization of debt levels, and enhanced liquidity to support expansion.Neslte India Ltd_Financial Model Working.pdf
Neslte India Ltd_Financial Model Working.pdfDeepakKumar234566
╠²
This document contains financial statements and analysis for a company over several years:
1) Income statements, balance sheets, cash flow statements and key financial ratios are presented for years 2018-2025 with actual data for 2018-2021 and estimates for 2022-2025.
2) The income statement shows steady revenue growth of 10% per year along with trends in expenses, profits and tax rates.
3) The balance sheet outlines asset and liability accounts with growth assumptions. Major assets include property/equipment, investments and current assets.
4) Cash flow statements show cash from operations exceeding cash used in investing and financing activities, resulting in positive cash flow overall.Valuation of Indian hospitality industry
Valuation of Indian hospitality industryShivani Chaluvadi
╠²
The document provides a comprehensive financial analysis of various Indian hospitality companies, detailing their income statements, expenses, and balance sheets from March 2006 to March 2016. It includes key figures such as revenue growth, profit after tax, and asset values, along with various financial ratios and metrics. Additionally, it looks at projected growth rates and market valuation of the industry, emphasizing the overall growth trajectory of the Indian hospitality sector.1. Prepare and analize the common statement for An.pdf
1. Prepare and analize the common statement for An.pdflejeunehayneswowel96
╠²
The document analyzes financial statements for Anandam Manufacturing Company, including common-size and cash flow statements, and provides detailed calculations for various financial ratios. Key findings highlight declining profitability, increasing operational expenses, and concerning liquidity ratios that fall below industry standards. As a result of the financial analysis, it is concluded that granting a loan to Anandam Financial Company is not advisable.The apollo tyres ltd
The apollo tyres ltdAjay Pandey
╠²
Apollo Tyres Ltd is an Indian tyre manufacturer founded in 1976 and headquartered in Gurgaon, India. It has four manufacturing plants located in India, South Africa, and Zimbabwe. Apollo Tyres generates most of its revenue from India but also has sales in Europe and Africa. The company prepares its financial statements according to Indian GAAP and uses the weighted average method to value its inventory, which includes raw materials, work in progress, finished goods, and stores/spare parts. Between 2013-2015, Apollo Tyres' revenues declined slightly but profits increased. The company also saw decreases in inventory levels and current assets over this period. Contingent liabilities are disclosed in the notes to the financial statementsAZN/ALXN
AZN/ALXNFranklin Monzon
╠²
The document provides a detailed financial overview of Alexion Pharmaceuticals, Inc. for several quarters, covering key metrics such as total revenue, gross profit, operating expenses, and net income. It indicates a trend of revenue growth, although with fluctuating gross profit margins and operating profit margins over the reported periods. The summary includes projections for future quarters, highlighting expected changes in revenue and profitability measures.tcs anual report analysis
tcs anual report analysisVi╩×aŲ©h ╩×umar
╠²
Tata Consultancy Services (TCS) is an Indian multinational information technology service and consulting company headquartered in Mumbai, India. Between 2012-2013, TCS's total revenue increased 24.19% while expenses rose 27.45%, however net profit increased 16.5%. The company generates most revenue from IT services and deploys both straight-line and written down value methods for depreciation. Equity shares represent 66% of share capital and shareholders' funds grew 22.95% over this period.Ntpc final
Ntpc finalAshish Ranjan
╠²
NTPC presented a financial statement analysis of its annual report for the financial year 2012-2013. Key highlights include:
- Revenue and net profit increased significantly from the previous year. Net profit rose 36.81% to Rs. 12,619.39 crores.
- Total assets increased to Rs. 1,33,641.17 crores from Rs. 1,20,629.50 crores the previous year.
- Cash flow from operating activities increased substantially to Rs. 15,495.17 crores from Rs. 10,709.85 crores.
- Liquidity and solvency ratios improved, indicating stronger financial position compared to the previous year.ATS Company Reports: Eclerx
ATS Company Reports: EclerxAditya Trading Solutions Pvt Ltd
╠²
Eclerx Services Ltd, established in 2000, specializes in knowledge process outsourcing with a workforce of 5,837 employees, focusing on data analytics and process optimization for clients across various industries. The company has achieved a market capitalization of Rs 3,964.14 crore, reporting consolidated sales of Rs 231.83 crore and a net profit of Rs 62.29 crore for the quarter ending September 2014, with a strong financial position and a good dividend payout history. Recommendations to buy the stock center around its sound financial health, higher margins compared to peers, and a well-diversified service portfolio.ACC DCF Valuation ppt (1) - Copy.pptx
ACC DCF Valuation ppt (1) - Copy.pptxjiteshthakur16
╠²
The document provides a discounted cash flow (DCF) valuation for ACC Limited, an Indian cement company. It includes projections for revenue, expenses, profits, capital expenditures, working capital, and free cash flows through 2026. It then calculates the weighted average cost of capital (WACC) of 10.71% and uses a 4% terminal growth rate to determine an intrinsic value per share of INR 2,409.47, higher than the current market price. Sensitivity analysis shows the valuation is robust to changes in the WACC and long-term growth rate.TCS Fact Sheet Q1 FY15
TCS Fact Sheet Q1 FY15Tata Consultancy Services
╠²
TCS reported financial results for the first quarter of fiscal year 2015, ending June 30, 2014. Revenue grew 2.6% quarter-over-quarter and 22.9% year-over-year in Indian Rupees. Operating margin was 26.3% and net income margin was 22.9%. Key highlights included strong growth in telecom, retail, and life sciences industries as well as an increase in large clients with over $50 million in annual revenues from TCS. The company added over 15,000 employees during the quarter.Ad
NBCC_Presentation_19.05.2016
- 13. 0 1000 2000 3000 4000 5000 6000 Income from Operation EBIT PBT PAT Net Worth FY 2015-16 5838 349 441 311 1505 FY 2014-15 4399 285 392 278 1338 Annual Performance FY 2015-16 (Rs. Cr) 33 % 22 % 13% 12 % 12 % ANNUAL FINANCIAL PERFORMANCE FY 2015-16
- 14. 0 1000 2000 3000 4000 5000 6000 FY 2015-16 FY 2014-15 Income from Operation 5838 4399 Income from Operation (Rs. cr) 33 % 0 100 200 300 400 FY 2015-16 FY 2014-15 EBIT 349 285 EBIT (Rs.cr.) 22 % 360 380 400 420 440 460 FY 2015-16 FY 2014-15 PBT 441 392 AxisTitle PBT (Rs.cr.) 12% 260 270 280 290 300 310 320 FY 2015-16 FY 2014-15 PAT 311 278 PAT (Rs.cr.) 13% ANNUAL FINANCIAL PERFORMANCE FY 2015-16
- 15. QUARTERLY PERFORMANCE FY 2015-16 0 500 1000 1500 2000 2500 Income from Operation EBIT PBT PAT Q4 FY 2015- 16 2313 182 200 141 Q4 FY 2014-15 1648 165 191 134 Q4 Financial Performance (Rs.cr.) 5 % 10 % 5 % 40 %
- 16. 185 190 195 200 Q4 FY 2015- 16 Q4 FY 2014-15 PBT 200 191 PBT (Rs.cr.) 5 % 130 132 134 136 138 140 142 Q4 FY 2015- 16 Q4 FY 2014-15 PAT 141 134 PAT (Rs.cr.) 5 % 155 160 165 170 175 180 185 Q4 FY 2015- 16 Q4 FY 2014-15 EBIT 182 165 EBIT 10 % 0 500 1000 1500 2000 2500 Q4 FY 2015- 16 Q4 FY 2014-15 Income from Operation 2313 1648 Income from Operation (Rs. Cr) 40% QUARTERLY PERFORMANCE FY 2015-16
