NETWORKS, RISKS AND DIVERSIFICATION
0 likes143 views

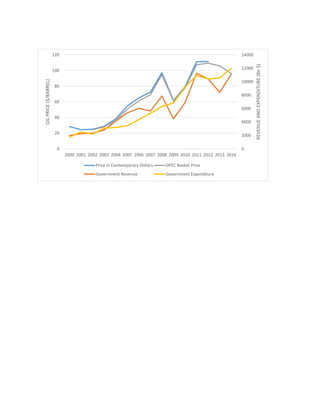
The document presents a graphical representation of revenue and expenditure data from 2000 to 2014, correlating it with oil prices per barrel. It highlights the trends in government revenue and expenditure alongside the fluctuations in the OPEC basket price. The analysis provides insights into the economic relationship between oil prices and government financial performance during this period.
1 of 1
Download to read offline
Ad
Recommended
¦ó¦Õ¦▌¦Ó¦ķ¦▀¦Ē¦ų ¦┌ ¦ß¦Ō¦Ó¦š¦Ó¦ė¦Ó¦▌¦Ņ¦Ń¦õ¦ė¦ų¦▀¦Ē¦ų ¦▐¦č¦į¦č¦┘¦┌¦▀¦Ē
¦ó¦Õ¦▌¦Ó¦ķ¦▀¦Ē¦ų ¦┌ ¦ß¦Ō¦Ó¦š¦Ó¦ė¦Ó¦▌¦Ņ¦Ń¦õ¦ė¦ų¦▀¦Ē¦ų ¦▐¦č¦į¦č¦┘¦┌¦▀¦ĒMaa Enkh
?
¦ź¦Ó¦▄¦Õ¦▐¦ų¦▀¦õ ¦Ó¦ß¦┌¦Ń¦Ē¦ė¦č¦ų¦õ ¦č¦Ń¦Ń¦Ó¦Ō¦õ¦┌¦▐¦ų¦▀¦õ ¦õ¦Ó¦ė¦č¦Ō¦Ó¦ė, ¦š¦Ó¦Ń¦õ¦Õ¦ß¦▀¦Ē¦ń ¦ė ¦ę¦Õ¦▌¦Ó¦ķ¦▀¦Ē¦ń ¦┌ ¦ß¦Ō¦Ó¦š¦Ó¦ė¦Ó¦▌¦Ņ¦Ń¦õ¦ė¦ų¦▀¦▀¦Ē¦ń ¦▐¦č¦į¦č¦┘¦┌¦▀¦č¦ń, ¦ė¦▄¦▌¦¦ķ¦č¦± ¦▐¦±¦Ń¦▀¦Ē¦ų, ¦Ō¦Ē¦ę¦▀¦Ē¦ų, ¦▐¦Ó¦▌¦Ó¦ķ¦▀¦Ē¦ų ¦┌ ¦ę¦č¦▄¦č¦▌¦ų¦ų¦█¦▀¦Ē¦ų ¦ß¦Ō¦Ó¦š¦Õ¦▄¦õ¦Ē. ¦Ż ¦▀¦ų¦▐ ¦ß¦ų¦Ō¦ų¦ķ¦┌¦Ń¦▌¦±¦¦õ¦Ń¦± ¦▄¦č¦õ¦ų¦į¦Ó¦Ō¦┌¦┌ ¦õ¦Ó¦ė¦č¦Ō¦Ó¦ė, ¦õ¦č¦▄¦┌¦ų ¦▄¦č¦▄ ¦▐¦±¦Ń¦Ó, ¦Ō¦Ē¦ę¦č, ¦▐¦Ó¦▌¦Ó¦ķ¦▀¦Ē¦ų ¦┌¦┘¦š¦ų¦▌¦┌¦±, ¦č¦▌¦▄¦Ó¦į¦Ó¦▌¦Ņ¦▀¦Ē¦ų ¦▀¦č¦ß¦┌¦õ¦▄¦┌ ¦┌ ¦ę¦č¦▄¦č¦▌¦ų¦±. ¦®¦č¦ė¦ų¦Ō¦Ļ¦ų¦▀¦┌¦ų ¦š¦Ó¦▄¦Õ¦▐¦ų¦▀¦õ¦č ¦ė¦Ē¦Ō¦č¦ž¦č¦ų¦õ ¦ę¦▌¦č¦į¦Ó¦š¦č¦Ō¦▀¦Ó¦Ń¦õ¦Ņ ¦┘¦č ¦ė¦▀¦┌¦▐¦č¦▀¦┌¦ų.Des syst©©mes de protection sociale bien con?us peuvent am©”liorer la vie de la...DRIVERS
?
Le projet drivers, coordonn©” par eurohealthnet et financ©” par le septi©©me programme-cadre de l'Union europ©”enne, examine comment les syst©©mes de protection sociale influencent les in©”galit©”s en mati©©re de sant©”. Il met en ©”vidence l'importance d'une couverture ©”lev©”e et de niveaux ad©”quats de prestations sociales pour am©”liorer la sant©”, en particulier chez les populations vuln©”rables. Le document propose ©”galement des recommandations pour renforcer les syst©©mes de protection sociale au niveau europ©”en afin de r©”duire ces in©”galit©”s.¦Ń¦▌¦Õ¦ž¦┌¦▌ ¦õ¦č¦▄¦Ó¦█ ¦ß¦č¦Ō¦ų¦▀¦Ņ
¦Ń¦▌¦Õ¦ž¦┌¦▌ ¦õ¦č¦▄¦Ó¦█ ¦ß¦č¦Ō¦ų¦▀¦ŅPetrovaMila
?
¦ź¦Ó¦▄¦Õ¦▐¦ų¦▀¦õ ¦Ō¦č¦Ń¦Ń¦▄¦č¦┘¦Ē¦ė¦č¦ų¦õ ¦Ó ¦ž¦┌¦┘¦▀¦┌ ¦▒¦č¦ė¦▌¦č ¦┴¦▄¦Ó¦ė¦▌¦ų¦ė¦┌¦ķ¦č ¦│¦Õ¦ė¦Ó¦Ō¦┌¦▀¦č, ¦▄¦Ó¦õ¦Ó¦Ō¦Ē¦█ ¦▀¦č¦ķ¦č¦▌ ¦ė¦Ó¦ų¦ė¦č¦õ¦Ņ ¦ė ¦ė¦Ó¦┘¦Ō¦č¦Ń¦õ¦ų 18 ¦▌¦ų¦õ, ¦Ó¦ę¦▐¦č¦▀¦Õ¦ė ¦ė¦Ó¦┘¦Ō¦č¦Ń¦õ ¦š¦▌¦± ¦ß¦Ó¦Ń¦õ¦Õ¦ß¦▌¦ų¦▀¦┌¦± ¦▀¦č ¦µ¦Ō¦Ó¦▀¦õ. ¦░¦▀ ¦Ń¦▌¦Õ¦ž¦┌¦▌ ¦ė ¦Ō¦č¦┘¦▌¦┌¦ķ¦▀¦Ē¦ń ¦ķ¦č¦Ń¦õ¦±¦ń ¦¼¦Ō¦č¦Ń¦▀¦Ó¦█ ¦Ī¦Ō¦▐¦┌¦┌, ¦Õ¦ķ¦č¦Ń¦õ¦ė¦Õ¦± ¦ė ¦┘¦▀¦č¦ķ¦┌¦▐¦Ē¦ń ¦ę¦┌¦õ¦ė¦č¦ń ¦ė¦Ó ¦Ż¦õ¦Ó¦Ō¦Ó¦█ ¦▐¦┌¦Ō¦Ó¦ė¦Ó¦█ ¦ė¦Ó¦█¦▀¦ų ¦┌ ¦ė¦Ó¦ų¦ė¦č¦▌ ¦ß¦Ō¦Ó¦õ¦┌¦ė ¦±¦ß¦Ó¦▀¦Ń¦▄¦Ó¦█ ¦č¦Ō¦▐¦┌¦┌ ¦ė ¦«¦č¦▀¦Ņ¦ķ¦ž¦Õ¦Ō¦┌¦┌. ¦▒¦Ó¦Ń¦▌¦ų ¦ė¦Ó¦█¦▀¦Ē ¦ė¦ų¦Ō¦▀¦Õ¦▌¦Ń¦± ¦š¦Ó¦▐¦Ó¦█, ¦ž¦┌¦▌ ¦ė ¦Ō¦Ó¦š¦▀¦Ó¦▐ ¦Ń¦ų¦▌¦ų, ¦Ń¦Ó¦┘¦š¦č¦▌ ¦Ń¦ų¦▐¦Ņ¦ ¦┌ ¦Ō¦č¦ę¦Ó¦õ¦č¦▌ ¦▀¦č ¦ž¦ų¦▌¦ų¦┘¦▀¦Ó¦█ ¦š¦Ó¦Ō¦Ó¦į¦ų, ¦Ó¦Ń¦õ¦č¦ė¦č¦±¦Ń¦Ņ ¦ß¦Ó ¦Ń¦Õ¦õ¦┌ ¦Ń¦▄¦Ō¦Ó¦▐¦▀¦Ē¦▐ ¦ķ¦ų¦▌¦Ó¦ė¦ų¦▄¦Ó¦▐, ¦▀¦ų ¦▌¦¦ę¦┌¦ė¦Ļ¦┌¦▐ ¦ė¦Ń¦ß¦Ó¦▐¦┌¦▀¦č¦õ¦Ņ ¦Ó ¦ę¦Ó¦ų¦ė¦Ē¦ń ¦š¦▀¦±¦ń.Air pollution
Air pollutionMuhammad Din
?
This document discusses several topics related to air quality and climate including photochemical smog and its environmental effects, key environmental issues in Pakistan, atmospheric chemistry, factors determining climate change, designing an air quality management program for Balochistan, Pakistan, effects of air pollutants on human health, air pollution episodes and sources, and ozone formation through mono atomic oxygen and NOx reactions.Damh1 duyvh
Damh1 duyvhX? Th? Tri?u ?©¼nh
?
T©żi li?u tr©¼nh b©ży v? ph?n m?m Intouch Wonderware v©ż c©óc kh©ói ni?m li©║n quan ??n SCADA v©ż HMI. N©« gi?i th©¬ch ch?c n?ng v©ż c?u tr©▓c c?a h? th?ng SCADA, bao g?m gi©óm s©ót, ?i?u khi?n v©ż thu th?p d? li?u, ??ng th?i nh?n m?nh vai tr©░ c?a HMI trong vi?c t??ng t©óc gi?a con ng??i v©ż h? th?ng. T©żi li?u c?ng ?? c?p ??n c©óc nguy©║n t?c ho?t ??ng v©ż c©óc th©żnh ph?n ch©¬nh c?a h? th?ng SCADA.9 jogos mortaisGiselly2
?
Este documento descreve um experimento observando a capacidade de regenera??o das plan©órias ao longo de 15 dias. O experimento envolve cortar uma plan©ória ao meio e observar cada metade regenerar completamente em duas novas plan©órias, gra?as ©żs c©”lulas-tronco das plan©órias chamadas neoblastos.Frank de Beun | Automotive seminar | Brandswitch-matrix
Frank de Beun | Automotive seminar | Brandswitch-matrix EDM
?
EDM is expert in database marketing. De Solutions ondersteunen marketeers bij het slimmer werven, behouden en ontwikkelen van klanten.
Bij EDM werken mensen met verstand van data en gevoel voor marketing. De unieke combinatie van data, systems en insights maken marketinginspanningen effectiever en de kosten variabel. Kortom, succesvoller!
Gebruik een van de Solutions en krijg data, systems en insights. Een consultant van EDM is te herkennen aan zijn DNA: ambitieus, innovatief, integer en pragmatisch.Tecladopapapitufo2013
?
El documento proporciona informaci©«n sobre las partes principales del teclado, incluyendo el teclado alfanum©”rico, el teclado num©”rico, las teclas de funci©«n y las teclas de direcci©«n. Tambi©”n describe los accesorios de Windows m©ós importantes como Paint, Wordpad y Calculator. Por ©▓ltimo, explica las partes del escritorio de Windows, incluyendo iconos, accesos directos y carpetas.OpenAIRE ║▌║▌▀Żs - Tutorial on compliance with proprietary repository platforms
OpenAIRE ║▌║▌▀Żs - Tutorial on compliance with proprietary repository platforms OpenAIRE
?
The document outlines the requirements for making research repositories OpenAIRE compliant, focusing on the integration of European Commission projects and licensing information. It discusses necessary local database changes to support associations between publications, licenses, and EC projects, and methods for automating the inference of links between past publications and their funding sources. The document also emphasizes the use of OpenAIRE's infrastructure and tools to facilitate compliance and enhance the publication deposition workflow for researchers.OpenAIRE at INFSO-RTD, Open Access Co-ordination Workshop, Brussels, May 2011
OpenAIRE at INFSO-RTD, Open Access Co-ordination Workshop, Brussels, May 2011OpenAIRE
?
1. OpenAIRE makes open access publications from European funded projects accessible by linking publications to projects and repositories.
2. It delivers participatory infrastructure by building on existing European repositories and technologies while pushing coordination and capitalizing on existing tools.
3. OpenAIRE provides unique added value for researchers, funders, and policymakers by enabling one-step deposition, assessing research impact, and establishing generic infrastructures beyond its original mandate.Am©”liorer lĪ»©”quit©” en mati©©re de sant©” par le biais dĪ»actions tout au long de...DRIVERS
?
Le document pr©”sente un rapport sur le projet 'drivers for health equity' coordonn©” par Eurohealthnet, visant ©ż am©”liorer l'©”quit©” en sant©” en Europe ©ż travers des actions tout au long de la vie. Il fait ©”tat des in©”galit©”s syst©”miques en mati©©re de sant©” et propose des recommandations bas©”es sur des recherches sur des facteurs influents comme le d©”veloppement de la petite enfance, les conditions de travail et la protection sociale. Le rapport souligne l'importance de politiques coordonn©”es pour r©”duire ces in©”galit©”s et favoriser la justice sociale.Automatic solder dipping machine to improve your PCBA quality
Automatic solder dipping machine to improve your PCBA qualityShenzhen Southern Machinery Sales And Service Co., Ltd
?
The document describes an auto-dip soldering machine called the S-500S. It has automatic slag removal, allows soldering of multiple batches at once, and improves efficiency over manual soldering. The machine parameters include a 350x300mm PCB size, adjustable speed and solder dwell time, PID temperature control from 0-450 degrees Celsius, and a 75kg weight. It is suitable for circuit boards, LEDs, toys, transformers and can save nearly 40% energy compared to other models.?Qui©”n dice la verdad sobre la operaci©«n jaque.1Omar Galvis
?
El video completo de la Operaci©«n Jaque publicado por RCN revela inconsistencias en la versi©«n oficial del gobierno. Muestra que el militar us©« el emblema del CICR durante todo el operativo, no solo por nerviosismo como dijo el Presidente. Tambi©”n confirma el uso de logos de Telesur. El gobierno cuestiona la filtraci©«n pero admite que en las primeras investigaciones no se revel©« toda la verdad. La publicaci©«n del video completo es leg©¬tima aunque revele errores del gobierno.Blind inspiration
Blind inspirationblindinspirationsyd
?
BlindInspiration in Australia has a collection of high-quality blinds, awnings, and shutters that can dramatically impact the interior space of any room. Their products are meant to help create a relaxing and comfortable home environment. Visitors to their showroom can get guidance from professional staff on a wide range of window dressing options like roller blinds, timber blinds, plantation shutters, awnings, and curtains.3. MMR Social Marketing strategy - Barking and Dagenham - SW project
3. MMR Social Marketing strategy - Barking and Dagenham - SW projectSam Woodhouse
?
This document presents a social marketing strategy to increase uptake of the MMR vaccination in Barking and Dagenham, UK. Uptake is currently below targets due to controversies over reported links between MMR and autism in the 1990s. The strategy aims to increase uptake in five deprived wards by targeting white, working class parents aged 20-34. Recommendations include mobile vaccination services, promotions to incentivize vaccination, and targeted media channels to convey messaging developed based on audience research. Implementation from September 2010 to July 2011 includes a full external evaluation with a ?60,000 budget.9 jogos mortaisGiselly2
?
Este documento descreve um experimento observando a capacidade de regenera??o das plan©órias ao longo de 15 dias. O experimento envolve cortar uma plan©ória ao meio e observar cada metade regenerar completamente em duas novas plan©órias, gra?as ©żs c©”lulas-tronco neoblastos presentes no corpo da plan©ória.Trabajo de Aplicaci©«n Artistica-Sociales.Fernando9609
?
Este documento presenta informaci©«n sobre varias familias y personas importantes de Antioquia en los siglos XIX y XX, as©¬ como sobre la sociedad y cultura de la ©”poca. Se describe a la familia Amador y su contribuci©«n a la econom©¬a a trav©”s del comercio y la miner©¬a, as©¬ como las actividades y logros de Luis Eduardo Yepes, Alejandro ?ngel y Pedro Nel Ospina en diferentes ©ómbitos. Tambi©”n se mencionan detalles sobre costumbres funerarias y religiosas de la ©”poca, as©¬ como las esculturas del cementerProduction
Productionlizzymcdonald1
?
The document provides a production schedule for filming a horror trailer over several dates. It details the times, actors, locations, and types of shots planned for each date to tell the story and build tension. Scenes will be filmed at a house and countryside road showing two main characters initially relaxing before one drives alone and strange events occur, isolating one character and leading to a climactic scene where the villain overpowers the others. The footage will then be reviewed and edited into a final teaser trailer.How Twitterate Are You? Teaching and Learning With Twitter
How Twitterate Are You? Teaching and Learning With TwitterAry Mas-Aranguiz
?
The document discusses the use of Twitter as a teaching and learning tool, highlighting its benefits for communication, resource sharing, and building personal learning networks (PLNs). It addresses common fears and misconceptions about Twitter, such as privacy concerns and information overload, while providing guidance on how to get started with the platform. Additionally, it outlines essential tools and strategies for enhancing both synchronous and asynchronous learning experiences through Twitter.Gigpro Pitch Deck
Gigpro Pitch DeckQuadBee Aderonke
?
This document discusses growing human capital through enabling education and skills development. It notes that people are the ultimate resource for growth but that unemployment and underemployment are problems in many countries. The proposal is to lower the costs of learning, earning and creating through a platform that connects customers to professional services at competitive rates while providing income opportunities. The business model would take a 10% commission and aims to expand offerings and partnerships over time to drive growth. Competition includes Lynk in Kenya, and the strategy considers pricing, leadership, owning distribution channels and a good user experience.THE IMPORTS-EXPORTS PUZZLE
THE IMPORTS-EXPORTS PUZZLEQuadBee Aderonke
?
The document discusses Nigeria's import and export dynamics and argues against the popular view of Nigeria having an "import dependency". It analyzes trade data which shows that while exports are below imports in terms of number of products, that gap has closed significantly over time. Imports have not overwhelmingly dominated exports when looking at their share of GDP or trade volumes. It also argues that having the right mix of exported products, including more high-income consumer goods, is important for growth but challenges include a country's income level and infrastructure deficits that raise production costs. Government policy should objectively support shifting to more productive industries and "pick losers", not indefinitely prop up unproductive ones.BLOG APPENDIX
BLOG APPENDIXQuadBee Aderonke
?
The document discusses Nigeria's policy to boost agriculture through $900m in funding. While the share of agricultural employment has fallen from 70% to 30%, agricultural productivity per worker has surged, showing no negative effect. Food production has also increased, approaching global averages. The plummeting share of agriculture in GDP is likely due to services overtaking other sectors globally. Simply increasing agricultural employment may not be the best policy, as food issues are better solved through improved transportation and storage infrastructure.INDUSTRIAL POLICY
INDUSTRIAL POLICYQuadBee Aderonke
?
The document discusses the challenges and debates surrounding industrial policy in developing nations, particularly Nigeria's decision to reject the EU/AU economic partnership agreement to protect local industries. It highlights the skepticism regarding the effectiveness of government interventions, especially in 'picking winners' among industries, and suggests that successful industrial policy requires careful assessment of growth potential and competitiveness. The author argues for a focus on public infrastructure investment rather than untested industrial policies, emphasizing the need for lessons learned from historical examples, including those from Asian economies.Inequality, Success, and Sustainability: An Introduction
Inequality, Success, and Sustainability: An IntroductionQuadBee Aderonke
?
1) The document discusses inequality as a major theme at the World Economic Forum in recent years. It focuses on Thomas Piketty's argument from his book "Capital in the 21st Century" that inequality will worsen over time if the rate of return on capital exceeds economic growth.
2) There is disagreement over how to address inequality, with debates around whether more economic growth or redistribution is the best solution. Supporters of growth argue everyone will benefit, while redistributionists say distribution cannot be disregarded.
3) The document argues that natural differences like ethnicity do not justify unequal outcomes and that capabilities are influenced by environment and luck. It proposes addressing inequality through inclusive growth and redistribution fundedTechnology & Social Interaction
Technology & Social InteractionQuadBee Aderonke
?
Technology is defined as the application of scientific knowledge for practical purposes or machinery developed from such knowledge. Historically, humans have socialized around shared experiences like food, events, and dates, but technology has changed social interaction. While technology may change how often families eat together or attend events, it allows people to stay connected even when busy and gives introverts new ways of social expression through social media. In the future, technology will continue to enhance how humans express themselves and spend their leisure time, while fundamental human needs like relationships and community will remain.Scaling-up Nature-Based Solutions through the NAP Process?
Scaling-up Nature-Based Solutions through the NAP Process?NAP Global Network
?
Scaling-up Nature-Based Solutions through the NAP Process?ūŅą┬░µ├└╣·╠’─╔╬„└Ē╣ż┤¾č¦▒ŽęĄųżŻ©░š░š▒½▒ŽęĄųż╩ķŻ®įŁ░µČ©ųŲ
ūŅą┬░µ├└╣·╠’─╔╬„└Ē╣ż┤¾č¦▒ŽęĄųżŻ©░š░š▒½▒ŽęĄųż╩ķŻ®įŁ░µČ©ųŲTaqyea
?
╝°ė┌┤╦Ż¼Č©ųŲ╠’─╔╬„└Ē╣ż┤¾č¦č¦╬╗ųż╩ķ╠ß╔²┬─└·ĪŠq▐▒1954292140Ī┐įŁ░µĖ▀Ę┬╠’─╔╬„└Ē╣ż┤¾č¦▒ŽęĄųż(TTU▒ŽęĄųż╩ķ)┐╔Ž╚┐┤│╔ŲĘč∙▒ŠĪŠq▐▒1954292140Ī┐░’─·ĮŌŠ÷į┌├└╣·╠’─╔╬„└Ē╣ż┤¾č¦╬┤▒ŽęĄ─č╠ŌŻ¼├└╣·▒ŽęĄųż╣║┬“Ż¼├└╣·╬─ŲŠ╣║┬“Ż¼ĪŠq╬ó1954292140Ī┐├└╣·╬─ŲŠ╣║┬“Ż¼├└╣·╬─ŲŠČ©ųŲŻ¼├└╣·╬─ŲŠ▓╣░ņĪŻū©ęĄį┌Ž▀Č©ųŲ├└╣·┤¾č¦╬─ŲŠŻ¼Č©ū÷├└╣·▒Š┐Ų╬─ŲŠŻ¼ĪŠq╬ó1954292140Ī┐Ė┤ųŲ├└╣·Tennessee Technological University completion letterĪŻį┌Ž▀┐ņ╦┘▓╣░ņ├└╣·▒Š┐Ų▒ŽęĄųżĪó╦Č╩┐╬─ŲŠųż╩ķŻ¼╣║┬“├└╣·č¦╬╗ųżĪó╠’─╔╬„└Ē╣ż┤¾č¦OfferŻ¼├└╣·┤¾č¦╬─ŲŠį┌Ž▀╣║┬“ĪŻ
╚ń╣¹─·┤”ė┌ęįŽ┬╝ĖųųŪķ┐÷Ż║
Ī¾į┌ąŻŲ┌╝õŻ¼ę“Ė„ųųįŁę“╬┤─▄╦│└¹▒ŽęĄĪŁĪŁ─├▓╗ĄĮ╣┘ĘĮ▒ŽęĄųż
Ī¾├µČįĖĖ─ĖĄ─č╣┴”Ż¼ŽŻ═¹ŠĪ┐ņ─├ĄĮŻ╗
Ī¾▓╗ŪÕ│■╚Žųż┴„│╠ęį╝░▓─┴ŽĖ├╚ń║╬ū╝▒ĖŻ╗
Ī¾╗ž╣·╩▒╝õ║▄│żŻ¼═³╝Ū░ņ└ĒŻ╗
Ī¾╗ž╣·┬Ē╔ŽŠ═꬚ę╣żū„Ż¼░ņĖ°ė├╚╦Ąź╬╗┐┤Ż╗
Ī¾Ų¾╩┬ꥥź╬╗▒žąļę¬Ū¾░ņ└ĒĄ─
Ī¾ąĶę¬▒©┐╝╣½╬±į▒Īó╣║┬“├Ō╦░│ĄĪó┬õū¬╗¦┐┌
Ī¾╔ĻŪļ┴¶č¦╔·┤┤ęĄ╗∙Į
ĪŠĖ┤┐╠ę╗╠ū╠’─╔╬„└Ē╣ż┤¾č¦▒ŽęĄųż│╔╝©Ąźą┼ĘŌĄ╚▓─┴ŽūŅŪ┐╣ź┬į,Buy Tennessee Technological University TranscriptsĪ┐
╣║┬“╚š║½│╔╝©ĄźĪóėó╣·┤¾č¦│╔╝©ĄźĪó├└╣·┤¾č¦│╔╝©ĄźĪó░─ų▐┤¾č¦│╔╝©ĄźĪó╝ė─├┤¾┤¾č¦│╔╝©ĄźŻ©q╬ó1954292140Ż®ą┬╝ėŲ┬┤¾č¦│╔╝©ĄźĪóą┬╬„└╝┤¾č¦│╔╝©ĄźĪó░«Č¹└╝│╔╝©ĄźĪó╬„░Óč└│╔╝©ĄźĪóĄ┬╣·│╔╝©ĄźĪŻ│╔╝©ĄźĄ─ęŌęÕų„ę¬╠ÕŽųį┌ųż├„覎░─▄┴”ĪóŲ└╣└č¦╩§▒│Š░Īóš╣╩Šū█║Ž╦žų╩Īó╠ßĖ▀┬╝╚Ī┬╩Ż¼ęį╝░╩Ūū„╬¬┴¶ą┼╚Žųż╔ĻŪļ▓─┴ŽĄ─ę╗▓┐ĘųĪŻ
╠’─╔╬„└Ē╣ż┤¾č¦│╔╝©Ąź─▄╣╗╠ÕŽų─·Ą─Ą─覎░─▄┴”Ż¼░³└©╠’─╔╬„└Ē╣ż┤¾č¦┐╬│╠│╔╝©Īóū©ęĄ─▄┴”Īó蹊┐─▄┴”ĪŻŻ©q╬ó1954292140Ż®Š▀╠Õ└┤╦ĄŻ¼│╔╝©▒©ĖµĄź═©│Ż░³║¼č¦╔·Ą─覎░╝╝─▄ėļŽ░╣▀ĪóĖ„┐Ų│╔╝©ęį╝░└Ž╩”Ų└ė’Ą╚▓┐ĘųŻ¼ę“┤╦Ż¼│╔╝©Ąź▓╗Į÷╩Ūč¦╔·č¦╩§─▄┴”Ą─ųż├„Ż¼ę▓╩ŪŲ└╣└č¦╔·╩Ūʱ╩╩║Ž─│Ė÷Į╠ė²ŽŅ─┐Ą─ųžę¬ę└Š▌ŻĪMore Related Content
Viewers also liked (13)
Tecladopapapitufo2013
?
El documento proporciona informaci©«n sobre las partes principales del teclado, incluyendo el teclado alfanum©”rico, el teclado num©”rico, las teclas de funci©«n y las teclas de direcci©«n. Tambi©”n describe los accesorios de Windows m©ós importantes como Paint, Wordpad y Calculator. Por ©▓ltimo, explica las partes del escritorio de Windows, incluyendo iconos, accesos directos y carpetas.OpenAIRE ║▌║▌▀Żs - Tutorial on compliance with proprietary repository platforms
OpenAIRE ║▌║▌▀Żs - Tutorial on compliance with proprietary repository platforms OpenAIRE
?
The document outlines the requirements for making research repositories OpenAIRE compliant, focusing on the integration of European Commission projects and licensing information. It discusses necessary local database changes to support associations between publications, licenses, and EC projects, and methods for automating the inference of links between past publications and their funding sources. The document also emphasizes the use of OpenAIRE's infrastructure and tools to facilitate compliance and enhance the publication deposition workflow for researchers.OpenAIRE at INFSO-RTD, Open Access Co-ordination Workshop, Brussels, May 2011
OpenAIRE at INFSO-RTD, Open Access Co-ordination Workshop, Brussels, May 2011OpenAIRE
?
1. OpenAIRE makes open access publications from European funded projects accessible by linking publications to projects and repositories.
2. It delivers participatory infrastructure by building on existing European repositories and technologies while pushing coordination and capitalizing on existing tools.
3. OpenAIRE provides unique added value for researchers, funders, and policymakers by enabling one-step deposition, assessing research impact, and establishing generic infrastructures beyond its original mandate.Am©”liorer lĪ»©”quit©” en mati©©re de sant©” par le biais dĪ»actions tout au long de...DRIVERS
?
Le document pr©”sente un rapport sur le projet 'drivers for health equity' coordonn©” par Eurohealthnet, visant ©ż am©”liorer l'©”quit©” en sant©” en Europe ©ż travers des actions tout au long de la vie. Il fait ©”tat des in©”galit©”s syst©”miques en mati©©re de sant©” et propose des recommandations bas©”es sur des recherches sur des facteurs influents comme le d©”veloppement de la petite enfance, les conditions de travail et la protection sociale. Le rapport souligne l'importance de politiques coordonn©”es pour r©”duire ces in©”galit©”s et favoriser la justice sociale.Automatic solder dipping machine to improve your PCBA quality
Automatic solder dipping machine to improve your PCBA qualityShenzhen Southern Machinery Sales And Service Co., Ltd
?
The document describes an auto-dip soldering machine called the S-500S. It has automatic slag removal, allows soldering of multiple batches at once, and improves efficiency over manual soldering. The machine parameters include a 350x300mm PCB size, adjustable speed and solder dwell time, PID temperature control from 0-450 degrees Celsius, and a 75kg weight. It is suitable for circuit boards, LEDs, toys, transformers and can save nearly 40% energy compared to other models.?Qui©”n dice la verdad sobre la operaci©«n jaque.1Omar Galvis
?
El video completo de la Operaci©«n Jaque publicado por RCN revela inconsistencias en la versi©«n oficial del gobierno. Muestra que el militar us©« el emblema del CICR durante todo el operativo, no solo por nerviosismo como dijo el Presidente. Tambi©”n confirma el uso de logos de Telesur. El gobierno cuestiona la filtraci©«n pero admite que en las primeras investigaciones no se revel©« toda la verdad. La publicaci©«n del video completo es leg©¬tima aunque revele errores del gobierno.Blind inspiration
Blind inspirationblindinspirationsyd
?
BlindInspiration in Australia has a collection of high-quality blinds, awnings, and shutters that can dramatically impact the interior space of any room. Their products are meant to help create a relaxing and comfortable home environment. Visitors to their showroom can get guidance from professional staff on a wide range of window dressing options like roller blinds, timber blinds, plantation shutters, awnings, and curtains.3. MMR Social Marketing strategy - Barking and Dagenham - SW project
3. MMR Social Marketing strategy - Barking and Dagenham - SW projectSam Woodhouse
?
This document presents a social marketing strategy to increase uptake of the MMR vaccination in Barking and Dagenham, UK. Uptake is currently below targets due to controversies over reported links between MMR and autism in the 1990s. The strategy aims to increase uptake in five deprived wards by targeting white, working class parents aged 20-34. Recommendations include mobile vaccination services, promotions to incentivize vaccination, and targeted media channels to convey messaging developed based on audience research. Implementation from September 2010 to July 2011 includes a full external evaluation with a ?60,000 budget.9 jogos mortaisGiselly2
?
Este documento descreve um experimento observando a capacidade de regenera??o das plan©órias ao longo de 15 dias. O experimento envolve cortar uma plan©ória ao meio e observar cada metade regenerar completamente em duas novas plan©órias, gra?as ©żs c©”lulas-tronco neoblastos presentes no corpo da plan©ória.Trabajo de Aplicaci©«n Artistica-Sociales.Fernando9609
?
Este documento presenta informaci©«n sobre varias familias y personas importantes de Antioquia en los siglos XIX y XX, as©¬ como sobre la sociedad y cultura de la ©”poca. Se describe a la familia Amador y su contribuci©«n a la econom©¬a a trav©”s del comercio y la miner©¬a, as©¬ como las actividades y logros de Luis Eduardo Yepes, Alejandro ?ngel y Pedro Nel Ospina en diferentes ©ómbitos. Tambi©”n se mencionan detalles sobre costumbres funerarias y religiosas de la ©”poca, as©¬ como las esculturas del cementerProduction
Productionlizzymcdonald1
?
The document provides a production schedule for filming a horror trailer over several dates. It details the times, actors, locations, and types of shots planned for each date to tell the story and build tension. Scenes will be filmed at a house and countryside road showing two main characters initially relaxing before one drives alone and strange events occur, isolating one character and leading to a climactic scene where the villain overpowers the others. The footage will then be reviewed and edited into a final teaser trailer.How Twitterate Are You? Teaching and Learning With Twitter
How Twitterate Are You? Teaching and Learning With TwitterAry Mas-Aranguiz
?
The document discusses the use of Twitter as a teaching and learning tool, highlighting its benefits for communication, resource sharing, and building personal learning networks (PLNs). It addresses common fears and misconceptions about Twitter, such as privacy concerns and information overload, while providing guidance on how to get started with the platform. Additionally, it outlines essential tools and strategies for enhancing both synchronous and asynchronous learning experiences through Twitter.Automatic solder dipping machine to improve your PCBA quality
Automatic solder dipping machine to improve your PCBA qualityShenzhen Southern Machinery Sales And Service Co., Ltd
?
More from QuadBee Aderonke (6)
Gigpro Pitch Deck
Gigpro Pitch DeckQuadBee Aderonke
?
This document discusses growing human capital through enabling education and skills development. It notes that people are the ultimate resource for growth but that unemployment and underemployment are problems in many countries. The proposal is to lower the costs of learning, earning and creating through a platform that connects customers to professional services at competitive rates while providing income opportunities. The business model would take a 10% commission and aims to expand offerings and partnerships over time to drive growth. Competition includes Lynk in Kenya, and the strategy considers pricing, leadership, owning distribution channels and a good user experience.THE IMPORTS-EXPORTS PUZZLE
THE IMPORTS-EXPORTS PUZZLEQuadBee Aderonke
?
The document discusses Nigeria's import and export dynamics and argues against the popular view of Nigeria having an "import dependency". It analyzes trade data which shows that while exports are below imports in terms of number of products, that gap has closed significantly over time. Imports have not overwhelmingly dominated exports when looking at their share of GDP or trade volumes. It also argues that having the right mix of exported products, including more high-income consumer goods, is important for growth but challenges include a country's income level and infrastructure deficits that raise production costs. Government policy should objectively support shifting to more productive industries and "pick losers", not indefinitely prop up unproductive ones.BLOG APPENDIX
BLOG APPENDIXQuadBee Aderonke
?
The document discusses Nigeria's policy to boost agriculture through $900m in funding. While the share of agricultural employment has fallen from 70% to 30%, agricultural productivity per worker has surged, showing no negative effect. Food production has also increased, approaching global averages. The plummeting share of agriculture in GDP is likely due to services overtaking other sectors globally. Simply increasing agricultural employment may not be the best policy, as food issues are better solved through improved transportation and storage infrastructure.INDUSTRIAL POLICY
INDUSTRIAL POLICYQuadBee Aderonke
?
The document discusses the challenges and debates surrounding industrial policy in developing nations, particularly Nigeria's decision to reject the EU/AU economic partnership agreement to protect local industries. It highlights the skepticism regarding the effectiveness of government interventions, especially in 'picking winners' among industries, and suggests that successful industrial policy requires careful assessment of growth potential and competitiveness. The author argues for a focus on public infrastructure investment rather than untested industrial policies, emphasizing the need for lessons learned from historical examples, including those from Asian economies.Inequality, Success, and Sustainability: An Introduction
Inequality, Success, and Sustainability: An IntroductionQuadBee Aderonke
?
1) The document discusses inequality as a major theme at the World Economic Forum in recent years. It focuses on Thomas Piketty's argument from his book "Capital in the 21st Century" that inequality will worsen over time if the rate of return on capital exceeds economic growth.
2) There is disagreement over how to address inequality, with debates around whether more economic growth or redistribution is the best solution. Supporters of growth argue everyone will benefit, while redistributionists say distribution cannot be disregarded.
3) The document argues that natural differences like ethnicity do not justify unequal outcomes and that capabilities are influenced by environment and luck. It proposes addressing inequality through inclusive growth and redistribution fundedTechnology & Social Interaction
Technology & Social InteractionQuadBee Aderonke
?
Technology is defined as the application of scientific knowledge for practical purposes or machinery developed from such knowledge. Historically, humans have socialized around shared experiences like food, events, and dates, but technology has changed social interaction. While technology may change how often families eat together or attend events, it allows people to stay connected even when busy and gives introverts new ways of social expression through social media. In the future, technology will continue to enhance how humans express themselves and spend their leisure time, while fundamental human needs like relationships and community will remain.Ad
Recently uploaded (20)
Scaling-up Nature-Based Solutions through the NAP Process?
Scaling-up Nature-Based Solutions through the NAP Process?NAP Global Network
?
Scaling-up Nature-Based Solutions through the NAP Process?ūŅą┬░µ├└╣·╠’─╔╬„└Ē╣ż┤¾č¦▒ŽęĄųżŻ©░š░š▒½▒ŽęĄųż╩ķŻ®įŁ░µČ©ųŲ
ūŅą┬░µ├└╣·╠’─╔╬„└Ē╣ż┤¾č¦▒ŽęĄųżŻ©░š░š▒½▒ŽęĄųż╩ķŻ®įŁ░µČ©ųŲTaqyea
?
╝°ė┌┤╦Ż¼Č©ųŲ╠’─╔╬„└Ē╣ż┤¾č¦č¦╬╗ųż╩ķ╠ß╔²┬─└·ĪŠq▐▒1954292140Ī┐įŁ░µĖ▀Ę┬╠’─╔╬„└Ē╣ż┤¾č¦▒ŽęĄųż(TTU▒ŽęĄųż╩ķ)┐╔Ž╚┐┤│╔ŲĘč∙▒ŠĪŠq▐▒1954292140Ī┐░’─·ĮŌŠ÷į┌├└╣·╠’─╔╬„└Ē╣ż┤¾č¦╬┤▒ŽęĄ─č╠ŌŻ¼├└╣·▒ŽęĄųż╣║┬“Ż¼├└╣·╬─ŲŠ╣║┬“Ż¼ĪŠq╬ó1954292140Ī┐├└╣·╬─ŲŠ╣║┬“Ż¼├└╣·╬─ŲŠČ©ųŲŻ¼├└╣·╬─ŲŠ▓╣░ņĪŻū©ęĄį┌Ž▀Č©ųŲ├└╣·┤¾č¦╬─ŲŠŻ¼Č©ū÷├└╣·▒Š┐Ų╬─ŲŠŻ¼ĪŠq╬ó1954292140Ī┐Ė┤ųŲ├└╣·Tennessee Technological University completion letterĪŻį┌Ž▀┐ņ╦┘▓╣░ņ├└╣·▒Š┐Ų▒ŽęĄųżĪó╦Č╩┐╬─ŲŠųż╩ķŻ¼╣║┬“├└╣·č¦╬╗ųżĪó╠’─╔╬„└Ē╣ż┤¾č¦OfferŻ¼├└╣·┤¾č¦╬─ŲŠį┌Ž▀╣║┬“ĪŻ
╚ń╣¹─·┤”ė┌ęįŽ┬╝ĖųųŪķ┐÷Ż║
Ī¾į┌ąŻŲ┌╝õŻ¼ę“Ė„ųųįŁę“╬┤─▄╦│└¹▒ŽęĄĪŁĪŁ─├▓╗ĄĮ╣┘ĘĮ▒ŽęĄųż
Ī¾├µČįĖĖ─ĖĄ─č╣┴”Ż¼ŽŻ═¹ŠĪ┐ņ─├ĄĮŻ╗
Ī¾▓╗ŪÕ│■╚Žųż┴„│╠ęį╝░▓─┴ŽĖ├╚ń║╬ū╝▒ĖŻ╗
Ī¾╗ž╣·╩▒╝õ║▄│żŻ¼═³╝Ū░ņ└ĒŻ╗
Ī¾╗ž╣·┬Ē╔ŽŠ═꬚ę╣żū„Ż¼░ņĖ°ė├╚╦Ąź╬╗┐┤Ż╗
Ī¾Ų¾╩┬ꥥź╬╗▒žąļę¬Ū¾░ņ└ĒĄ─
Ī¾ąĶę¬▒©┐╝╣½╬±į▒Īó╣║┬“├Ō╦░│ĄĪó┬õū¬╗¦┐┌
Ī¾╔ĻŪļ┴¶č¦╔·┤┤ęĄ╗∙Į
ĪŠĖ┤┐╠ę╗╠ū╠’─╔╬„└Ē╣ż┤¾č¦▒ŽęĄųż│╔╝©Ąźą┼ĘŌĄ╚▓─┴ŽūŅŪ┐╣ź┬į,Buy Tennessee Technological University TranscriptsĪ┐
╣║┬“╚š║½│╔╝©ĄźĪóėó╣·┤¾č¦│╔╝©ĄźĪó├└╣·┤¾č¦│╔╝©ĄźĪó░─ų▐┤¾č¦│╔╝©ĄźĪó╝ė─├┤¾┤¾č¦│╔╝©ĄźŻ©q╬ó1954292140Ż®ą┬╝ėŲ┬┤¾č¦│╔╝©ĄźĪóą┬╬„└╝┤¾č¦│╔╝©ĄźĪó░«Č¹└╝│╔╝©ĄźĪó╬„░Óč└│╔╝©ĄźĪóĄ┬╣·│╔╝©ĄźĪŻ│╔╝©ĄźĄ─ęŌęÕų„ę¬╠ÕŽųį┌ųż├„覎░─▄┴”ĪóŲ└╣└č¦╩§▒│Š░Īóš╣╩Šū█║Ž╦žų╩Īó╠ßĖ▀┬╝╚Ī┬╩Ż¼ęį╝░╩Ūū„╬¬┴¶ą┼╚Žųż╔ĻŪļ▓─┴ŽĄ─ę╗▓┐ĘųĪŻ
╠’─╔╬„└Ē╣ż┤¾č¦│╔╝©Ąź─▄╣╗╠ÕŽų─·Ą─Ą─覎░─▄┴”Ż¼░³└©╠’─╔╬„└Ē╣ż┤¾č¦┐╬│╠│╔╝©Īóū©ęĄ─▄┴”Īó蹊┐─▄┴”ĪŻŻ©q╬ó1954292140Ż®Š▀╠Õ└┤╦ĄŻ¼│╔╝©▒©ĖµĄź═©│Ż░³║¼č¦╔·Ą─覎░╝╝─▄ėļŽ░╣▀ĪóĖ„┐Ų│╔╝©ęį╝░└Ž╩”Ų└ė’Ą╚▓┐ĘųŻ¼ę“┤╦Ż¼│╔╝©Ąź▓╗Į÷╩Ūč¦╔·č¦╩§─▄┴”Ą─ųż├„Ż¼ę▓╩ŪŲ└╣└č¦╔·╩Ūʱ╩╩║Ž─│Ė÷Į╠ė²ŽŅ─┐Ą─ųžę¬ę└Š▌ŻĪDFARS Part 234 - Major System Acquisition
DFARS Part 234 - Major System AcquisitionJSchaus & Associates
?
2025 - JSchaus & Associates in Washington DC present a complimentary webinar series covering The DFARS, Defense Federal Acquisition Regulation Supplement. Learn about US Federal Government Contracting with The Department of Defense, DoD. Defense Contracting. Defense Acquisition. Federal Contracting.
Link To Video:
https://youtu.be/SORHJtPuZrI
Subscribe to Our YouTube Channel for complimentary access to US Federal Government Contracting videos:
https://www.youtube.com/@jenniferschaus/videosCompetency of Interactive Diplomacy.pdf.pdf
Competency of Interactive Diplomacy.pdf.pdfgiselladarfian
?
LetĪ»s talk about contemporary debates in IR and Diplomacy on Energy and Environment!Joseph Lamar Simmons Shares 7 Legal Facts About Government Surveillance.pdf
Joseph Lamar Simmons Shares 7 Legal Facts About Government Surveillance.pdfJoseph Lamar Simmons
?
Joseph Lamar Simmons shares seven facts every citizen should know about surveillance laws. This pdf simplifies complex legal frameworks to help you stay informed and aware of your rights in a digital world.02_PED_20250212-PPT-Completeness Check for PPP Projects_V2 (1).pdf
02_PED_20250212-PPT-Completeness Check for PPP Projects_V2 (1).pdfKASC
?
The completeness check for unsolicited proposals involves verifying that all necessary documents and information are included in the proposal before it can be formally considered for a Public-Private Partnership (PPP) project. This process, managed by the PPP Center, ensures that the proposal is thorough and meets the requirements for further evaluation. International expert workshop on forestry for the future 26-28 May 2025: Pres...
International expert workshop on forestry for the future 26-28 May 2025: Pres...OECD Environment
?
Presentation by Piotr Borkowski, Executive Director, European State Forest Association (EUSTAFOR)DFARS Part 235 - Reseach And Development Contracts
DFARS Part 235 - Reseach And Development ContractsJSchaus & Associates
?
2025 - JSchaus & Associates in Washington DC present a complimentary webinar series covering The DFARS, Defense Federal Acquisition Regulation Supplement. Learn about US Federal Government Contracting with The Department of Defense, DoD. Defense Contracting. Defense Acquisition. Federal Contracting.
Link To Video:
https://www.youtube.com/watch?v=puBw_ehen7Y
Subscribe to Our YouTube Channel for complimentary access to US Federal Government Contracting videos:
https://www.youtube.com/@jenniferschaus/videosFinal Demonstration Three Branches of Government.pptx
Final Demonstration Three Branches of Government.pptxdanilynolinares
?
Demonstration on Three Branches of GovernmentTrusted Site To Buy Verified Payoneer Accounts In This Time.pdf
Trusted Site To Buy Verified Payoneer Accounts In This Time.pdfhttps://top5starshop.com/product/buy-verified-cash-app-accounts/
?
? 24/7 Hours Reply/Contact ? Telegram: @Top5StarShop ? WhatsApp: +1 (470) 206-8684 ? Email: top5starshop99@gmail.comEFOW Paper : Our World Energy Challenge (CONCEPT).docx (3).pdf
EFOW Paper : Our World Energy Challenge (CONCEPT).docx (3).pdfEnergy for One World
?
EFOW Publication
11th June 2025
This research paper provides an independent view on the future of global energy. It is important to note that this paper has been generated with the assistance of artificial intelligence (AI), drawing upon a collective knowledge base from the cloud.
The purpose of this paper is to offer insights and perspectives on the challenges and opportunities related to energy, energy transition, and change. It aims to inform and potentially steer the agenda and working ways in these areas. Therefore, the contents of this paper should be considered within this context.
Please be also advised that this research paper has been prepared with the assistance of artificial intelligence (AI). Therefore, this document does not necessarily reflect the opinions, thoughts, lessons learned or working ways of Mission Energy For One World. Readers should consider this when interpreting the content and drawing conclusions from the information presented.
ūŅą┬░µĄ┬╣·Ą┬└█╦╣Č┘ę¶└ųč¦į║▒ŽęĄųżŻ©HfM Dresden▒ŽęĄųż╩ķŻ®Č©ųŲ
ūŅą┬░µĄ┬╣·Ą┬└█╦╣Č┘ę¶└ųč¦į║▒ŽęĄųżŻ©HfM Dresden▒ŽęĄųż╩ķŻ®Č©ųŲ Taqyea
?
Ė┤┐╠ę╗╠ūč¦╬╗ųż╩ķĪŠq▐▒1954292140Ī┐╝°ė┌┤╦╣║┬“Ą┬└█╦╣Č┘ę¶└ųč¦į║ūŅą┬░µ▒ŽęĄųż═╝Ų¼šµ╩ĄŽĖ─ÕĄ─ėĪ╦óą¦╣¹ŠĪ╩šč█Ąū,č¦╬╗ųż1:1═Ļ├└╗╣įŁ║Ż═ŌĖ„┤¾č¦▒ŽęĄ▓─┴Ž╔ŽĄ─╣żęšŻ║╦«ėĪŻ¼ę§ė░Ąū╬ŲŻ¼ĖųėĪLOGO╠╠Į╠╠ę°Ż¼LOGO╠╠Į╠╠ę°Ė┤║ŽųžĄ■ĪŻ╬─ūų═╝░ĖĖĪĄ±Īó╝ż╣Ō└ž╔õĪóūŽ═Ōė½╣ŌĪó╬┬ĖąĪóĖ┤ėĪĘ└╬▒Ą╚Ę└╬▒╣żęšĪŻBuy Hochschule f©╣r Musik Carl Maria von Weber Dresden DiplomaĪČš²╩Į│╔╝©Ąź┬█╬─├╗╣²ĪĘėą╬─ŲŠ╚┤Ą├▓╗ĄĮ╚ŽųżĪŻėųĖ├į§├┤░ņŻ┐╝°ė┌┤╦Ż¼╣║┬“Ą┬╣·▒ŽęĄųżĪŠq╬ó1954292140Ī┐Ą┬╣·╬─ŲŠ╣║┬“Ż¼Ą┬╣·╬─ŲŠ╣║┬“Ż¼Ą┬╣·╬─ŲŠČ©ųŲŻ¼Ą┬╣·╬─ŲŠ▓╣░ņĪŻū©ęĄį┌Ž▀Č©ųŲĄ┬╣·┤¾č¦╬─ŲŠŻ¼Č©ū÷Ą┬╣·▒Š┐Ų╬─ŲŠŻ¼ĪŠq╬ó1954292140Ī┐Ė┤ųŲĄ┬╣·Hochschule f©╣r Musik Carl Maria von Weber Dresden completion letterĪŻ
ĪŠč¦└·╚Žųż┴„│╠Ą┬└█╦╣Č┘ę¶└ųč¦į║▒ŽęĄųżĄ┬╣·▒Š┐Ų│╔╝©ĄźųŲū„Buy Hochschule f©╣r Musik Carl Maria von Weber Dresden TranscriptsĪ┐
╣║┬“╚š║½│╔╝©ĄźĪóėó╣·┤¾č¦│╔╝©ĄźĪó├└╣·┤¾č¦│╔╝©ĄźĪó░─ų▐┤¾č¦│╔╝©ĄźĪó╝ė─├┤¾┤¾č¦│╔╝©ĄźŻ©q╬ó1954292140Ż®ą┬╝ėŲ┬┤¾č¦│╔╝©ĄźĪóą┬╬„└╝┤¾č¦│╔╝©ĄźĪó░«Č¹└╝│╔╝©ĄźĪó╬„░Óč└│╔╝©ĄźĪóĄ┬╣·│╔╝©ĄźĪŻ│╔╝©ĄźĄ─ęŌęÕų„ę¬╠ÕŽųį┌ųż├„覎░─▄┴”ĪóŲ└╣└č¦╩§▒│Š░Īóš╣╩Šū█║Ž╦žų╩Īó╠ßĖ▀┬╝╚Ī┬╩Ż¼ęį╝░╩Ūū„╬¬┴¶ą┼╚Žųż╔ĻŪļ▓─┴ŽĄ─ę╗▓┐ĘųĪŻ
Ą┬└█╦╣Č┘ę¶└ųč¦į║│╔╝©Ąź─▄╣╗╠ÕŽų─·Ą─Ą─覎░─▄┴”Ż¼░³└©Ą┬└█╦╣Č┘ę¶└ųč¦į║┐╬│╠│╔╝©Īóū©ęĄ─▄┴”Īó蹊┐─▄┴”ĪŻŻ©q╬ó1954292140Ż®Š▀╠Õ└┤╦ĄŻ¼│╔╝©▒©ĖµĄź═©│Ż░³║¼č¦╔·Ą─覎░╝╝─▄ėļŽ░╣▀ĪóĖ„┐Ų│╔╝©ęį╝░└Ž╩”Ų└ė’Ą╚▓┐ĘųŻ¼ę“┤╦Ż¼│╔╝©Ąź▓╗Į÷╩Ūč¦╔·č¦╩§─▄┴”Ą─ųż├„Ż¼ę▓╩ŪŲ└╣└č¦╔·╩Ūʱ╩╩║Ž─│Ė÷Į╠ė²ŽŅ─┐Ą─ųžę¬ę└Š▌ŻĪ
ų„ė¬ŽŅ─┐Ż║
1Īóšµ╩ĄĮ╠ė²▓┐╣·═Ōč¦└·č¦╬╗╚ŽųżĪČĄ┬╣·▒ŽęĄ╬─ŲŠųż╩ķ┐ņ╦┘░ņ└ĒĄ┬└█╦╣Č┘ę¶└ųč¦į║╣║┬“▒ŽęĄųżĪĘĪŠq╬ó1954292140Ī┐ĪČ┬█╬─├╗╣²Ą┬└█╦╣Č┘ę¶└ųč¦į║š²╩Į│╔╝©ĄźĪĘŻ¼Į╠ė²▓┐┤µĄĄŻ¼Į╠ė²▓┐┴¶Ę■═°šŠ100%┐╔▓ķ.
2Īó░ņ└ĒHfM Dresden▒ŽęĄųżŻ¼Ė─│╔╝©ĄźĪČHfM Dresden▒ŽęĄųż├„░ņ└ĒĄ┬└█╦╣Č┘ę¶└ųč¦į║│╔╝©ĄźČ©╣║ĪĘĪŠQ/WeChatŻ║1954292140Ī┐Buy Hochschule f©╣r Musik Carl Maria von Weber Dresden CertificatesĪČš²╩Į│╔╝©Ąź┬█╬─├╗╣²ĪĘŻ¼Ą┬└█╦╣Č┘ę¶└ųč¦į║OfferĪóį┌Č┴ųż├„Īóč¦╔·┐©Īóą┼ĘŌĪóųż├„ą┼Ą╚╚½╠ū▓─┴ŽŻ¼┤ėĘ└╬▒ĄĮėĪ╦óŻ¼┤ė╦«ėĪĄĮĖųėĪ╠╠ĮŻ¼Ė▀Š½Ę┬Č╚Ė·č¦ąŻįŁ░µ100%ŽÓ═¼.
3Īóšµ╩Ą╩╣╣▌╚ŽųżŻ©╝┤┴¶č¦╚╦į▒╗ž╣·ųż├„Ż®Ż¼╩╣╣▌┤µĄĄ┐╔═©╣²┤¾╩╣╣▌▓ķč»╚Ę╚Ž.
4Īó┴¶ą┼═°╚ŽųżŻ¼╣·╝ęū©ęĄ╚╦▓┼╚Žųżųąą─░õĘó╚ļ┐Ōųż╩ķŻ¼┴¶ą┼═°┤µĄĄ┐╔▓ķ.
į┌Ž▀ųŲū„Ą┬└█╦╣Č┘ę¶└ųč¦į║▒ŽęĄųż╩ķ1╠ņų«─┌═Ļ│╔ĪŠq╬ó1954292140Ī┐Ą┬└█╦╣Č┘ę¶└ųč¦į║│╔╝©Ąźę╗šŠ╩Į░ņ└Ēū©ęĄ╝╝╩§═Ļ├└│╩Žų,░ņ└ĒĄ┬└█╦╣Č┘ę¶└ųč¦į║│╔╝©ĄźĖ▀ų╩┴┐▒Ż├▄Ą─Ė÷ąį╗»Ę■╬±Ė▀Ę┬šµ╗╣įŁĄ┬╣·╬─ŲŠųż╩ķ║══Ō┐ŪŻ¼Č©ųŲĄ┬╣·Ą┬└█╦╣Č┘ę¶└ųč¦į║│╔╝©Ąź║═ą┼ĘŌĪŻ▒ŽęĄųżČ©ųŲHfM Dresden▒ŽęĄųżĪŠq╬ó1954292140Ī┐╣·═Ō╬─ŲŠųŲū„┤·░ņ┴„│╠Ą┬└█╦╣Č┘ę¶└ųč¦į║offer/č¦╬╗ųżį┌Č┴ųż├„░ņ└ĒĪó┴¶ą┼╣┘ĘĮč¦└·╚ŽųżŻ©ė└Š├┤µĄĄšµ╩Ą┐╔▓ķŻ®▓╔ė├覹ŻįŁ░µųĮš┼Īó╠ž╩Ō╣żęš═Ļ╚½░┤ššįŁ░µę╗▒╚ę╗ųŲū„ĪŻ░’─ŃĮŌŠ÷Ą┬└█╦╣Č┘ę¶└ųč¦į║č¦└·č¦╬╗╚Žųż─č╠ŌĪŻTrusted Site To Buy Verified Payoneer Accounts In This Time.pdf
Trusted Site To Buy Verified Payoneer Accounts In This Time.pdfhttps://top5starshop.com/product/buy-verified-cash-app-accounts/
?
Ad
NETWORKS, RISKS AND DIVERSIFICATION
- 1. 0 2000 4000 6000 8000 10000 12000 14000 0 20 40 60 80 100 120 2000 2001 2002 2003 2004 2005 2006 2007 2008 2009 2010 2011 2012 2013 2014 REVENUEANDEXPENDITURE(Bn$) OILPRICE($/BARREL) Price in Contemporary Dollars OPEC Basket Price Government Revenue Government Expenditure