New Relic .NET Agent Overview
4 likes2,733 views

The document discusses how to monitor .NET applications using New Relic RPM. It explains that the New Relic RPM agent collects performance metrics from .NET applications and sends them to the New Relic service. Users can then sign up for a free RPM account, download and install the .NET agent to begin seeing performance metrics for their application within minutes in the New Relic user interface. The interface provides various dashboards and reports to help users track application performance, errors, database queries and more.
1 of 27
Downloaded 82 times
Ad
Recommended
New Relic: Optimizing The Database SQL and NoSQL Alike
New Relic: Optimizing The Database SQL and NoSQL AlikeBrian Doll
╠²
The document discusses how the New Relic RPM tool can be used to monitor and optimize SQL and NoSQL databases. It provides metrics on database performance, queries, transactions, and scalability. Custom instrumentation can also be added for databases not supported by default. The presentation emphasizes that detailed database metrics are crucial for identifying bottlenecks and ensuring applications scale effectively.Monitoring the Dynamic Nature of the Cloud [FutureStack16 NYC]
Monitoring the Dynamic Nature of the Cloud [FutureStack16 NYC]New Relic
╠²
This document discusses monitoring applications in dynamic cloud environments like Docker and AWS Lambda. It notes that traditional server monitoring is insufficient for dynamic infrastructure where components have short lifecycles. It recommends monitoring at the application level using tools that provide end-to-end visibility from code to infrastructure. Monitoring is needed for component lifecycles and to maintain accountability between code and cloud resources.Technical Webinar with AWS - Everything You Need to Measure in Your Migration
Technical Webinar with AWS - Everything You Need to Measure in Your MigrationNew Relic
╠²
This webinar discusses strategies for measuring application performance during a migration to AWS. It emphasizes starting instrumentation early in the planning process to establish performance baselines and uncover dependencies. The webinar covers portfolio discovery steps like identifying applications, servers, and connections to determine resource needs. It also discusses common migration strategies like re-hosting, re-purchasing, or refactoring applications. Finally, it stresses the importance of ongoing monitoring and optimization after migration to resolve issues and fine-tune performance.Building A System That Never Stops [FutureStack16 NYC]
Building A System That Never Stops [FutureStack16 NYC]New Relic
╠²
Nic Benders, Chief Architect at New Relic, discusses lessons learned from building a system that processes over 21 million requests per minute and stores over 4.3 petabytes of data. Some key lessons include: building a culture tolerant of change, recognizing that synchronous operations become problematic at scale, mastering rollout techniques to update systems smoothly, and using technology to enable an effective organizational culture.How to Build a SaaS App With Twitter-like Throughput on Just 9 Servers
How to Build a SaaS App With Twitter-like Throughput on Just 9 ServersNew Relic
╠²
The document outlines how New Relic efficiently handles application monitoring on just 9 servers, managing over 20 billion daily metrics from 150,000 application processes. It highlights the architecture, data collection rates, and real-time monitoring capabilities, emphasizing the application's simplicity and scalability. Key challenges include data purging, MySQL optimization, and handling large accounts, with five lessons learned regarding best practices in app development.New Relic Infrastructure: Servers Transition August 2017
New Relic Infrastructure: Servers Transition August 2017New Relic
╠²
The document outlines a webinar hosted by New Relic on the transition from New Relic servers to its new infrastructure, focusing on features and benefits for modern IT environments. It includes tips for transitioning, a demonstration of the infrastructure's capabilities, and testimonials from users. The webinar also covers an overview of New Relic's digital intelligence platform, alerting features, and next steps for attendees.New Relic + Apprenda Webinar
New Relic + Apprenda WebinarPeter Duke
╠²
The document discusses a collaboration between Apprenda and New Relic to enhance monitoring and management of applications in enterprise IT environments. It highlights the benefits of Apprenda's Platform as a Service (PaaS) in enabling secure and efficient application development and deployment across clouds. The partnership aims to reduce time to market and operational costs through improved visibility and automation in application performance management.Managing the Customer Experience for Media ŌĆō Web, Mobile, and Video
Managing the Customer Experience for Media ŌĆō Web, Mobile, and VideoNew Relic
╠²
The document is a recording of a webinar hosted by New Relic, focusing on media and video performance metrics and optimization strategies. It covers key performance indicators (KPIs) for backend workflows, mobile app optimization, video quality of service (QoS), viewer engagement, and customer activation. The presentation aims to help media companies enhance user experience and improve subscription conversion rates through data-driven insights.Let's Talk ProIV and Alexa
Let's Talk ProIV and AlexaAndrew Turner
╠²
The document discusses PROIV, a low-code platform designed to streamline application development and enhance digital transformation. It details the creation of an Alexa skill that interacts with PROIV services to manage order inquiries, providing a conversational flow between the user and Alexa. Various technical configurations for deploying the service, including AWS Lambda and EC2 instances, are also described.Flink Forward Berlin 2018: Lasse Nedergaard - "Our successful journey with Fl...
Flink Forward Berlin 2018: Lasse Nedergaard - "Our successful journey with Fl...Flink Forward
╠²
Trackunit's journey with Apache Flink began with version 1.2, focusing on real-time streaming pipelines and IoT services to optimize operations in the construction industry. Over the years, they encountered various performance challenges and made several improvements, including transitioning to Kafka and incorporating extensive metrics for better monitoring. The document emphasizes the importance of automated testing, monitoring, and logging for effective system management and troubleshooting.The Performance and Scalability Mindset
The Performance and Scalability MindsetBrian Doll
╠²
The document discusses the importance of performance and scalability in software applications. It provides an overview of New Relic's application performance monitoring (APM) service, which instruments applications to collect metrics on performance and usage. New Relic's APM monitors over 175,000 application processes globally for over 10,000 customers, collecting billions of metrics per day from web pages and applications written in various programming languages. It also discusses lessons learned in scaling New Relic's own systems to handle the large volume of collected metrics data.Flink Forward Berlin 2018: Wei-Che (Tony) Wei - "Lessons learned from Migrati...
Flink Forward Berlin 2018: Wei-Che (Tony) Wei - "Lessons learned from Migrati...Flink Forward
╠²
The document discusses lessons learned from migrating to a stateful streaming framework at Appier, highlighting the transition from micro-batching to true streaming with Apache Flink. It includes key use cases, challenges faced during the migration, and valuable tips such as the importance of documentation, monitoring, and familiarization with the environment. Overall, it emphasizes that stateful streaming requires thoughtful design and is sensitive to its operational environment.New relic
New relicsweekar Attavar K
╠²
This document discusses application performance monitoring using New Relic. It introduces New Relic as a SaaS tool that allows users to understand and solve real-time performance issues in web applications in production. Some key features of New Relic mentioned are monitoring end user load times down to the database call level, application monitoring, browser monitoring for JavaScript errors and Ajax failures, database monitoring for slow queries and issues, and insights into geographic metrics.Growing into a proactive Data Platform
Growing into a proactive Data PlatformLivePerson
╠²
The document outlines the evolution and implementation of a proactive data platform at LivePerson, detailing stages from initial awareness to advanced auditing and loss detection mechanisms. It covers the challenges faced in data management, including issues with data loss, troubleshooting, and fortifying systems against interruptions. The implementation also includes tools for measuring data freshness and auditing controls to enhance operational efficiency and ensure reliability.It's What's Inside that Counts!
It's What's Inside that Counts!New Relic
╠²
This document provides an overview of New Relic's app-centric Docker monitoring capabilities. It begins with introductions of Andrew Marshall, a senior product marketing manager, and Adam Larson, a software engineering manager. The webinar agenda is then outlined, covering why software monitoring is needed, an introduction to New Relic, Docker, and how Docker is used. It then demonstrates Docker monitoring in New Relic before providing steps to get started. Key points about New Relic's Docker monitoring include that it prioritizes useful over impressive information, optimizes for the present since the future is unclear, and fixes issues like not treating containers as first-class nodes.The Future of APM and Why It Requires Analytics Everywhere!
The Future of APM and Why It Requires Analytics Everywhere!New Relic
╠²
The document discusses the future of application performance management (APM) and emphasizes the necessity of analytics across various dimensions to ensure application health and customer experience. It illustrates how managing software has evolved into a big data challenge, requiring lossless, dimensional data for effective performance management. Additionally, it highlights the integration of APM tools to gain insights into user engagement and business operations.Customer Driven DevOps at Work: Operating the Digital Turnstile [FutureStack1...
Customer Driven DevOps at Work: Operating the Digital Turnstile [FutureStack1...New Relic
╠²
MLB Advanced Media (MLBAM) provides digital media distribution for MLB. They have evolved from early streaming in 2002 with few devices and low quality to now being a top streaming service. MLBAM has also evolved their "digital turnstile" approach to access by expanding platforms and partners. They have moved to a DevOps model from siloed development, deployment, and operations teams. This involved adopting AWS for infrastructure and New Relic for monitoring to improve collaboration, transparency, and issue response across teams. New Relic helps MLBAM understand performance of their distributed systems and partners to quickly address issues that could impact the fan experience.Support Office Hour Webinar - LivePerson API
Support Office Hour Webinar - LivePerson API LivePerson
╠²
The document presents a support session led by Nitay Bartal, a technical leader at LivePerson, discussing the benefits and offerings of LivePerson APIs, emphasizing the importance for developers. It covers various API functionalities, including chat integration and enhanced engagement tools, followed by a demonstration and Q&A session. The session highlights LivePerson's capability to improve agent productivity and enrich the customer engagement experience across multiple platforms.Do DevOps Right with New Relic
Do DevOps Right with New RelicNew Relic
╠²
The webinar discusses effective DevOps practices using New Relic, highlighting the importance of automation, measurement, and cultural change within teams. Key topics include tackling challenges such as siloed operations and the need for a single source of truth across development and operations. Attendees are encouraged to utilize New Relic's tools to enhance DevOps efforts and measure performance effectively.Integrating Security Controls into the Development and Delivery Pipeline
Integrating Security Controls into the Development and Delivery PipelineAkamai Developers & Admins
╠²
This document discusses integrating security controls into the development and delivery pipeline using DevOps practices. It asks where readers are in their DevOps evolution and how increased release velocity has impacted their application security posture. It then describes how Akamai is enabling DevOps practices on its cloud security products, including adding SIEM integration and APIs for rapid feedback, and plans to add Kona Site Defender APIs for critical security configurations and fast activation of changes. The document aims to address the needs for real-time visibility, ability to automate all infrastructure components, and fast changes.Enterprise Cloud Adoption Strategies
Enterprise Cloud Adoption StrategiesLee Atchison
╠²
This document discusses strategies for cloud adoption. It outlines typical progressions that companies follow when adopting the cloud, from experimenting with non-critical services to fully mandating cloud usage. It also discusses parallel progressions that application teams follow, from using peripheral cloud services to building applications committed to unique cloud capabilities. The document emphasizes that different companies and applications will progress at different speeds and have different needs. It provides strategies for successful cloud adoption, including understanding one's culture and needs, monitoring adoption, and driving cultural change. It also discusses how AWS CloudWatch and New Relic can work together to provide monitoring of infrastructure and applications in the cloud.Finding application problems before they impact users
Finding application problems before they impact usersCA Application Performance Management (APM)
╠²
The document discusses the importance of application performance management (APM) in identifying and resolving application issues before they affect users, drawing parallels with infrastructure monitoring. It outlines the components of CA APM, including end-user experience analytics, application-delivery analysis, and root-cause diagnostics to enhance application quality and performance. The APM solution aims to provide a comprehensive, end-to-end view of business transactions and application behavior to improve user satisfaction and operational efficiency.5 keys to high availability applications
5 keys to high availability applicationsLee Atchison
╠²
The document discusses 5 keys to building high availability web applications: 1) develop applications with availability in mind by anticipating failures, 2) always plan for scaling to increasing traffic, 3) mitigate risks through redundancy, fallback mechanisms, and rapid failure detection, 4) monitor applications to establish baselines and detect anomalies, and 5) ensure responsive availability through incident response processes, alerting, and escalation procedures.Automation at the Edge
Automation at the EdgeAkamai Developers & Admins
╠²
This document discusses automating Content Delivery Network (CDN) management through continuous integration and continuous delivery (CI/CD) pipelines. It recommends treating CDN configurations as code artifacts and including the CDN in the automated testing lifecycle. This allows the CDN to adhere to the same standards as other code artifacts and assets. It also minimizes manual steps required to deploy to production. The document provides considerations for implementing CDN CI/CD pipelines and presents a case study of a sample CDN delivery pipeline.Akamai for Dev Ops Current Capabilities - Atlanta DevOps World Tour
Akamai for Dev Ops Current Capabilities - Atlanta DevOps World TourAkamai Developers & Admins
╠²
Akamai provides tools to automate workflows and integrate with DevOps pipelines. This includes APIs to manage configurations, fast content purges, and real-time monitoring. It also offers services like load testing, personalization, and traffic management that can offload work from origins to the edge network. The goal is to enable developers to deploy code faster while gaining visibility into performance and security.Using SaltStack to Auto Triage and Remediate Production Systems
Using SaltStack to Auto Triage and Remediate Production SystemsMichael Kehoe
╠²
The document discusses LinkedIn's implementation of auto-remediation using SaltStack to manage production systems, addressing challenges like high alert volumes and complicated runbooks that affected response times. It details the development of an event-based system called Nurse, which integrates with existing monitoring infrastructures to automate actions and diagnostics, thereby enhancing service reliability and reducing manual workloads. The success is highlighted by the automation of approximately 37,000 man-hours and proactive management of service alerts, reinforcing the importance of thoughtful architecture in event-driven automation.New Relic Zapier Case Study Platform
New Relic Zapier Case Study PlatformNew Relic
╠²
Zapier is a company that connects web applications to automate tasks without writing code. They use New Relic to monitor their complex application environment across many servers and technologies. New Relic provides visibility into performance issues and alerts Zapier to problems before users are affected. The New Relic Platform allows Zapier to view metrics from services like Redis and RabbitMQ in a single dashboard, improving productivity over separate monitoring tools. New Relic helped Zapier identify and address issues quickly to optimize performance.Webinar - Life's Too Short for Cloud without Analytics
Webinar - Life's Too Short for Cloud without AnalyticsLee Atchison
╠²
The document discusses monitoring applications in dynamic cloud environments. It notes that cloud infrastructure is monitored by services like CloudWatch, but these don't provide visibility into application performance. New Relic is described as monitoring both the server infrastructure and applications to provide a more complete view. The document also discusses how applications are becoming more dynamic with microservices and containers that have very short lifecycles, making them challenging to monitor using traditional approaches.How New Relic Develops Language Agents [FutureStack16]
How New Relic Develops Language Agents [FutureStack16]New Relic
╠²
This document discusses how New Relic builds language agents for new programming languages and frameworks. It outlines 10 lessons learned from building agents for future stacks: 1) Pay attention to what developers are talking about. 2) Use constraints to inspire innovation. 3) Encourage experimentation, including failures. 4) Rapidly mature by reducing cycle time. 5) It's okay to ask for help. 6) Accept that some bets will be lost. 7) Time with customers is worth 10x coding time. 8) Use data to know where to focus development efforts. 9) Curate every new stack experience. 10) Always have new technologies simmering that could be the next big thing.More Related Content
What's hot (20)
Let's Talk ProIV and Alexa
Let's Talk ProIV and AlexaAndrew Turner
╠²
The document discusses PROIV, a low-code platform designed to streamline application development and enhance digital transformation. It details the creation of an Alexa skill that interacts with PROIV services to manage order inquiries, providing a conversational flow between the user and Alexa. Various technical configurations for deploying the service, including AWS Lambda and EC2 instances, are also described.Flink Forward Berlin 2018: Lasse Nedergaard - "Our successful journey with Fl...
Flink Forward Berlin 2018: Lasse Nedergaard - "Our successful journey with Fl...Flink Forward
╠²
Trackunit's journey with Apache Flink began with version 1.2, focusing on real-time streaming pipelines and IoT services to optimize operations in the construction industry. Over the years, they encountered various performance challenges and made several improvements, including transitioning to Kafka and incorporating extensive metrics for better monitoring. The document emphasizes the importance of automated testing, monitoring, and logging for effective system management and troubleshooting.The Performance and Scalability Mindset
The Performance and Scalability MindsetBrian Doll
╠²
The document discusses the importance of performance and scalability in software applications. It provides an overview of New Relic's application performance monitoring (APM) service, which instruments applications to collect metrics on performance and usage. New Relic's APM monitors over 175,000 application processes globally for over 10,000 customers, collecting billions of metrics per day from web pages and applications written in various programming languages. It also discusses lessons learned in scaling New Relic's own systems to handle the large volume of collected metrics data.Flink Forward Berlin 2018: Wei-Che (Tony) Wei - "Lessons learned from Migrati...
Flink Forward Berlin 2018: Wei-Che (Tony) Wei - "Lessons learned from Migrati...Flink Forward
╠²
The document discusses lessons learned from migrating to a stateful streaming framework at Appier, highlighting the transition from micro-batching to true streaming with Apache Flink. It includes key use cases, challenges faced during the migration, and valuable tips such as the importance of documentation, monitoring, and familiarization with the environment. Overall, it emphasizes that stateful streaming requires thoughtful design and is sensitive to its operational environment.New relic
New relicsweekar Attavar K
╠²
This document discusses application performance monitoring using New Relic. It introduces New Relic as a SaaS tool that allows users to understand and solve real-time performance issues in web applications in production. Some key features of New Relic mentioned are monitoring end user load times down to the database call level, application monitoring, browser monitoring for JavaScript errors and Ajax failures, database monitoring for slow queries and issues, and insights into geographic metrics.Growing into a proactive Data Platform
Growing into a proactive Data PlatformLivePerson
╠²
The document outlines the evolution and implementation of a proactive data platform at LivePerson, detailing stages from initial awareness to advanced auditing and loss detection mechanisms. It covers the challenges faced in data management, including issues with data loss, troubleshooting, and fortifying systems against interruptions. The implementation also includes tools for measuring data freshness and auditing controls to enhance operational efficiency and ensure reliability.It's What's Inside that Counts!
It's What's Inside that Counts!New Relic
╠²
This document provides an overview of New Relic's app-centric Docker monitoring capabilities. It begins with introductions of Andrew Marshall, a senior product marketing manager, and Adam Larson, a software engineering manager. The webinar agenda is then outlined, covering why software monitoring is needed, an introduction to New Relic, Docker, and how Docker is used. It then demonstrates Docker monitoring in New Relic before providing steps to get started. Key points about New Relic's Docker monitoring include that it prioritizes useful over impressive information, optimizes for the present since the future is unclear, and fixes issues like not treating containers as first-class nodes.The Future of APM and Why It Requires Analytics Everywhere!
The Future of APM and Why It Requires Analytics Everywhere!New Relic
╠²
The document discusses the future of application performance management (APM) and emphasizes the necessity of analytics across various dimensions to ensure application health and customer experience. It illustrates how managing software has evolved into a big data challenge, requiring lossless, dimensional data for effective performance management. Additionally, it highlights the integration of APM tools to gain insights into user engagement and business operations.Customer Driven DevOps at Work: Operating the Digital Turnstile [FutureStack1...
Customer Driven DevOps at Work: Operating the Digital Turnstile [FutureStack1...New Relic
╠²
MLB Advanced Media (MLBAM) provides digital media distribution for MLB. They have evolved from early streaming in 2002 with few devices and low quality to now being a top streaming service. MLBAM has also evolved their "digital turnstile" approach to access by expanding platforms and partners. They have moved to a DevOps model from siloed development, deployment, and operations teams. This involved adopting AWS for infrastructure and New Relic for monitoring to improve collaboration, transparency, and issue response across teams. New Relic helps MLBAM understand performance of their distributed systems and partners to quickly address issues that could impact the fan experience.Support Office Hour Webinar - LivePerson API
Support Office Hour Webinar - LivePerson API LivePerson
╠²
The document presents a support session led by Nitay Bartal, a technical leader at LivePerson, discussing the benefits and offerings of LivePerson APIs, emphasizing the importance for developers. It covers various API functionalities, including chat integration and enhanced engagement tools, followed by a demonstration and Q&A session. The session highlights LivePerson's capability to improve agent productivity and enrich the customer engagement experience across multiple platforms.Do DevOps Right with New Relic
Do DevOps Right with New RelicNew Relic
╠²
The webinar discusses effective DevOps practices using New Relic, highlighting the importance of automation, measurement, and cultural change within teams. Key topics include tackling challenges such as siloed operations and the need for a single source of truth across development and operations. Attendees are encouraged to utilize New Relic's tools to enhance DevOps efforts and measure performance effectively.Integrating Security Controls into the Development and Delivery Pipeline
Integrating Security Controls into the Development and Delivery PipelineAkamai Developers & Admins
╠²
This document discusses integrating security controls into the development and delivery pipeline using DevOps practices. It asks where readers are in their DevOps evolution and how increased release velocity has impacted their application security posture. It then describes how Akamai is enabling DevOps practices on its cloud security products, including adding SIEM integration and APIs for rapid feedback, and plans to add Kona Site Defender APIs for critical security configurations and fast activation of changes. The document aims to address the needs for real-time visibility, ability to automate all infrastructure components, and fast changes.Enterprise Cloud Adoption Strategies
Enterprise Cloud Adoption StrategiesLee Atchison
╠²
This document discusses strategies for cloud adoption. It outlines typical progressions that companies follow when adopting the cloud, from experimenting with non-critical services to fully mandating cloud usage. It also discusses parallel progressions that application teams follow, from using peripheral cloud services to building applications committed to unique cloud capabilities. The document emphasizes that different companies and applications will progress at different speeds and have different needs. It provides strategies for successful cloud adoption, including understanding one's culture and needs, monitoring adoption, and driving cultural change. It also discusses how AWS CloudWatch and New Relic can work together to provide monitoring of infrastructure and applications in the cloud.Finding application problems before they impact users
Finding application problems before they impact usersCA Application Performance Management (APM)
╠²
The document discusses the importance of application performance management (APM) in identifying and resolving application issues before they affect users, drawing parallels with infrastructure monitoring. It outlines the components of CA APM, including end-user experience analytics, application-delivery analysis, and root-cause diagnostics to enhance application quality and performance. The APM solution aims to provide a comprehensive, end-to-end view of business transactions and application behavior to improve user satisfaction and operational efficiency.5 keys to high availability applications
5 keys to high availability applicationsLee Atchison
╠²
The document discusses 5 keys to building high availability web applications: 1) develop applications with availability in mind by anticipating failures, 2) always plan for scaling to increasing traffic, 3) mitigate risks through redundancy, fallback mechanisms, and rapid failure detection, 4) monitor applications to establish baselines and detect anomalies, and 5) ensure responsive availability through incident response processes, alerting, and escalation procedures.Automation at the Edge
Automation at the EdgeAkamai Developers & Admins
╠²
This document discusses automating Content Delivery Network (CDN) management through continuous integration and continuous delivery (CI/CD) pipelines. It recommends treating CDN configurations as code artifacts and including the CDN in the automated testing lifecycle. This allows the CDN to adhere to the same standards as other code artifacts and assets. It also minimizes manual steps required to deploy to production. The document provides considerations for implementing CDN CI/CD pipelines and presents a case study of a sample CDN delivery pipeline.Akamai for Dev Ops Current Capabilities - Atlanta DevOps World Tour
Akamai for Dev Ops Current Capabilities - Atlanta DevOps World TourAkamai Developers & Admins
╠²
Akamai provides tools to automate workflows and integrate with DevOps pipelines. This includes APIs to manage configurations, fast content purges, and real-time monitoring. It also offers services like load testing, personalization, and traffic management that can offload work from origins to the edge network. The goal is to enable developers to deploy code faster while gaining visibility into performance and security.Using SaltStack to Auto Triage and Remediate Production Systems
Using SaltStack to Auto Triage and Remediate Production SystemsMichael Kehoe
╠²
The document discusses LinkedIn's implementation of auto-remediation using SaltStack to manage production systems, addressing challenges like high alert volumes and complicated runbooks that affected response times. It details the development of an event-based system called Nurse, which integrates with existing monitoring infrastructures to automate actions and diagnostics, thereby enhancing service reliability and reducing manual workloads. The success is highlighted by the automation of approximately 37,000 man-hours and proactive management of service alerts, reinforcing the importance of thoughtful architecture in event-driven automation.New Relic Zapier Case Study Platform
New Relic Zapier Case Study PlatformNew Relic
╠²
Zapier is a company that connects web applications to automate tasks without writing code. They use New Relic to monitor their complex application environment across many servers and technologies. New Relic provides visibility into performance issues and alerts Zapier to problems before users are affected. The New Relic Platform allows Zapier to view metrics from services like Redis and RabbitMQ in a single dashboard, improving productivity over separate monitoring tools. New Relic helped Zapier identify and address issues quickly to optimize performance.Webinar - Life's Too Short for Cloud without Analytics
Webinar - Life's Too Short for Cloud without AnalyticsLee Atchison
╠²
The document discusses monitoring applications in dynamic cloud environments. It notes that cloud infrastructure is monitored by services like CloudWatch, but these don't provide visibility into application performance. New Relic is described as monitoring both the server infrastructure and applications to provide a more complete view. The document also discusses how applications are becoming more dynamic with microservices and containers that have very short lifecycles, making them challenging to monitor using traditional approaches.Integrating Security Controls into the Development and Delivery Pipeline
Integrating Security Controls into the Development and Delivery PipelineAkamai Developers & Admins
╠²
Viewers also liked (7)
How New Relic Develops Language Agents [FutureStack16]
How New Relic Develops Language Agents [FutureStack16]New Relic
╠²
This document discusses how New Relic builds language agents for new programming languages and frameworks. It outlines 10 lessons learned from building agents for future stacks: 1) Pay attention to what developers are talking about. 2) Use constraints to inspire innovation. 3) Encourage experimentation, including failures. 4) Rapidly mature by reducing cycle time. 5) It's okay to ask for help. 6) Accept that some bets will be lost. 7) Time with customers is worth 10x coding time. 8) Use data to know where to focus development efforts. 9) Curate every new stack experience. 10) Always have new technologies simmering that could be the next big thing.Lessons Learned Managing Large AWS Environments
Lessons Learned Managing Large AWS EnvironmentsRonald Bradford
╠²
The document outlines lessons learned from managing large AWS environments based on Ronald Bradford's consulting experiences with various clients, ranging from small to large server deployments. Key topics include AWS products and ecosystem, cost management, security practices, instrumentation for performance monitoring, and strategies for ensuring scalability and business continuity. The presentation emphasizes the importance of automation, cost-saving measures, and preparation for failures in cloud infrastructure management.Do DevOps Right with New Relic
Do DevOps Right with New RelicNew Relic
╠²
The webinar, led by Michael Coughlin from New Relic, focuses on effective DevOps practices, emphasizing the importance of cultural change, automation, and measurement. It discusses breaking down silos between teams and implementing tools for monitoring application performance and deployment processes. Key recommendations include using New Relic's capabilities for tracking performance metrics, automating testing, and improving collaboration across teams.Monitoring your technology stack with New Relic
Monitoring your technology stack with New RelicRonald Bradford
╠²
The document is a detailed overview of monitoring MySQL and other databases using New Relic, authored by Ronald Bradford, who has extensive experience in the field. It discusses various monitoring options, installation processes, and specific configurations for integrating New Relic with different server environments and programming languages. Additionally, it covers limitations of monitoring systems and emphasizes the importance of having robust monitoring in place for identifying and resolving database performance issues.Application Architecture Summit - Monitoring the Dynamic Cloud
Application Architecture Summit - Monitoring the Dynamic Cloud New Relic
╠²
The document discusses the dynamic cloud application architecture and emphasizes the cloud's role as a 'better data center' that enables faster app development and improved resource allocation. It highlights the need for effective monitoring of dynamic cloud environments, particularly focusing on applications, microservices, and infrastructure integrated with tools like AWS CloudWatch and New Relic. Additionally, it addresses the evolution from traditional data center operations to a more agile, scalable cloud model, exemplified through technologies like Docker and AWS Lambda.New Relic
New RelicGene Chuang
╠²
This document summarizes New Relic, a software performance monitoring tool. It provides an overview of New Relic's history and competitors. Key points covered include how New Relic supports various programming languages and platforms, its ease of setup and use, different feature sets across pricing tiers, and examples of customer spend. The document also briefly discusses New Relic's future opportunities around analytics, security, container monitoring, and strategic partnerships.Ad
Similar to New Relic .NET Agent Overview (20)
Finding and fixing top performance issues with new relic rpm
Finding and fixing top performance issues with new relic rpmBrian Doll
╠²
This document summarizes Brian Doll's presentation on finding and fixing performance issues using New Relic RPM. It discusses the top 5 performance issues companies encounter: 1) repetitive work syndrome/insufficient caching, 2) web service dependencies causing domino effects, 3) insufficient system resources, 4) slow SQL queries, and 5) N+1 query problems. The presentation provides examples of each issue and explains how New Relic RPM can help companies monitor applications, troubleshoot issues, and optimize performance. It also discusses how RPM works and integrates with applications.APM for Enterprise WhitePaper from New Relic
APM for Enterprise WhitePaper from New RelicNew Relic
╠²
New Relic is a web application performance management tool that allows users to monitor the performance of their web applications from end to end. It provides visibility into application performance from the user experience down to the code level to help identify and address bottlenecks. Customers can see performance across their entire technology stack, including servers, databases and applications, from a single interface. New Relic's SaaS-based model provides these capabilities with minimal setup and costs compared to on-premise alternatives. It helps optimize applications and ensure high quality user experiences.Shining new light on lucene solr performance and monitoring
Shining new light on lucene solr performance and monitoringLucidworks (Archived)
╠²
The document discusses the functionalities and optimization features of New Relic's RPM, highlighting its use in managing application performance and search quality. It includes a brief guide on implementation and provides links for further resources, along with a promotional code. Key personnel mentioned are Brian Doll and Eran Yaniv, both associated with New Relic.10 Things You Can Do With New Relic - Number 9 Will Shock You
10 Things You Can Do With New Relic - Number 9 Will Shock YouNew Relic
╠²
This document discusses 10 things that can be done with New Relic, a performance monitoring and analytics tool. It begins by noting that many people may not be correctly measuring performance and outlines how to measure perceived performance through key elements like load times and interactions. It then discusses learning more about New Relic usage through daily usage events and audit events that track account changes. The document concludes by stating that following best practices with New Relic's toolkits can provide proven ways to solve business challenges through tutorials, artifacts, and help options.Monitoring End User Experiences with New Relic & Splunk
Monitoring End User Experiences with New Relic & SplunkAbner Germanow
╠²
The document discusses the integration of Splunk and New Relic to enhance monitoring and observability in operational environments. It highlights the challenges of monitoring due to the exponential growth of operational data and the resulting silos created by various tools and platforms. The collaboration aims to provide a comprehensive view of application performance, enabling teams to diagnose issues more effectively and streamline their data analysis processes.What should we work on next?
What should we work on next?Brian Doll
╠²
The document discusses various topics related to app performance engineering at New Relic, including tuning apps without getting bogged down in maintenance, proactive vs reactive approaches, maintaining value through performance, Apdex, optimizing for real world use, database transactions, web transactions, bottlenecks, building value, technical debt, A/B testing, custom dashboards, and racing in an exhibit hall. It provides perspective from Brian Doll, an app performance engineer at New Relic, on what teams should focus on next to improve performance without excessive maintenance work.Gc new relic
Gc new relicDealmaker Media
╠²
New Relic provides application performance monitoring tools that give customers deep visibility into their web applications' performance and scalability in production. Their flagship product, New Relic RPM, is deployed as software as a service and is the first application-centric APM tool offered this way. It monitors, troubleshoots, and tunes web applications deployed both in the cloud and on-premises. In contrast to traditional APM tools that require hardware installation and consultants, New Relic RPM can be installed via a simple two-minute process and immediately provides results through an online service with no private user data accessed. They have grown to over 3,500 customers in 22 months, including notable companies and over 1,500 customers usingTech Talk #5 : USING NEWRELIC IN MOBILE DEVELOPMENT -Phan ─É├¼nh Th├Īi
Tech Talk #5 : USING NEWRELIC IN MOBILE DEVELOPMENT -Phan ─É├¼nh Th├Īi Nexus FrontierTech
╠²
This document discusses using New Relic for mobile development. New Relic provides application performance monitoring (APM) by instrumenting code to monitor performance metrics like transaction times. APM allows developers to monitor real-time mobile performance, analyze errors from real users, and compare performance across app versions and devices. The document outlines how to use New Relic's mobile features to monitor network errors, view crash reports, and track other key performance indicators to improve the user experience.New relic
New relicPablo Molnar
╠²
This document summarizes New Relic's key features including out-of-the-box monitoring of real user performance, server monitoring, and proactive notifications. It also discusses advanced features for deeper performance analytics and complementary tools for monitoring jobs. The presentation concludes with discussing New Relic's backlog including custom tiers, deployment notifications, and custom alerts.New Relic_Heroku_Presentation_Dreamforce11
New Relic_Heroku_Presentation_Dreamforce11New Relic
╠²
The document provides an overview of New Relic's Application Performance Monitoring (APM) solution, which offers real-time visibility and performance analysis for web applications deployed on platforms like Heroku. It highlights key features such as transaction-level monitoring, error tracking, scalability analysis, and the ability to report on performance metrics following deployments. The document emphasizes the importance of monitoring application performance to improve user experience and optimize resource utilization.Improving end user experiences with New Relic Browser and Synthetics
Improving end user experiences with New Relic Browser and SyntheticsNew Relic
╠²
The document discusses the importance of enhancing digital customer experiences using New Relic's browser and synthetic monitoring tools. It emphasizes that poor digital experiences can harm customer retention and highlights the need for full visibility across technology stacks to identify performance issues. The content also mentions significant metrics related to page load times and conversion rates, showcasing how New Relic aids in improving and monitoring digital performance.Delivering Consistently Great Mobile Experiences
Delivering Consistently Great Mobile ExperiencesNew Relic
╠²
The document emphasizes the importance of application performance and user experience in mobile and desktop environments, highlighting that 49% of users expect page load times under 2 seconds. It discusses how forward-looking statements should not be solely relied upon by investors or third parties due to inherent risks and uncertainties. Additionally, the document outlines a customer experience hierarchy of needs relating to availability, functionality, and performance, along with the need for continuous improvement based on user interactions and measurements.FutureStack16 NYC Opening Keynote
FutureStack16 NYC Opening KeynoteNew Relic
╠²
The document announces FutureStack16, New Relic's user conference with events in London, New York City, and San Francisco. It introduces the president and other speakers at the event. It also provides a brief summary of New Relic's product evolution over 9 years and previews upcoming innovations to provide greater visibility into applications, infrastructure, and non-SQL databases.FutureStack'19 Closing Keynote
FutureStack'19 Closing KeynoteLee Atchison
╠²
The document discusses how modern applications require modern monitoring and processes to stay performing. It notes that modern applications operate on dynamic cloud infrastructures with constant changes, requiring monitoring of business success, application performance, and customer experience. It emphasizes the importance of managing risk through understanding and mitigating risks rather than removing risks. It also discusses how DevOps is a cultural change involving team-level responsibility and ownership. The presentation aims to explain how instrumentation, infrastructure management, risk management, and DevOps culture can help keep modern applications running effectively.New Relic - May 2015 Meetup @ thetrainline
New Relic - May 2015 Meetup @ thetrainlinetrainline Engineering
╠²
The document discusses The Trainline's implementation of New Relic to enhance customer happiness by improving application monitoring and error management. By transitioning to a subscription model, they achieved near-real-time error logging, performance metrics, and proactive issue resolution, which significantly reduced error rates. Future goals include expanding custom attributes and monitoring capabilities across different application environments.Understanding Microservice Latency for DevOps Teams: An Introduction to New R...
Understanding Microservice Latency for DevOps Teams: An Introduction to New R...New Relic
╠²
The document discusses New Relic's distributed tracing, highlighting its significance in managing microservice latency for DevOps teams. It explains how distributed tracing helps troubleshoot and optimize microservice architectures by providing insights into service dependencies and error identification. The presentation emphasizes the easy integration of New Relic's tools to enhance performance and operational efficiency in modern software systems.Performance metrics for a social network
Performance metrics for a social networkThierry Schellenbach
╠²
This document discusses performance metrics for monitoring and optimizing a social network built using Django/Python. It recommends tools like New Relic for high-level insights, Graphite for detailed metrics storage and querying, and PgFouine for analyzing database queries. Specific metrics discussed include page load times broken down by component, database query analysis, background task performance, and deploy impact. The goal is to identify bottlenecks and optimize performance across development, systems, and pages.How to Monitor Your Java & .NET Applications with eG Enterprise
How to Monitor Your Java & .NET Applications with eG EnterpriseeG Innovations
╠²
The document outlines a webinar hosted by EG Innovations focused on their application performance monitoring (APM) solution, EG Enterprise. It covers topics such as the evolution of EG Enterprise, key capabilities including real user monitoring and transaction tracing for Java and .NET applications, and how these tools address application performance issues. The presentation emphasizes the importance of converged application and infrastructure performance visibility to enhance user experience and troubleshoot IT problems effectively.Fashiolista
Fashiolistanlwebperf
╠²
This document discusses performance metrics for monitoring and optimizing a social network application. It recommends collecting metrics at various levels, including development, system health, and page-level performance. It describes tools for each level like Debug Toolbar, New Relic, Graphite, Cloudwatch, and PgFouine. Graphite is highlighted as a tool for storing vast amounts of metrics data that can then be queried and visualized in different ways. The document provides examples of specific metrics that could be tracked, like database query times, cache performance, task processing times, and deploy monitoring. It emphasizes that collecting a wide range of metrics across the application stack helps identify bottlenecks and optimize performance.Lew Cirne, FS16 Keynote [FutureStack16]
Lew Cirne, FS16 Keynote [FutureStack16] New Relic
╠²
This document provides information about New Relic, Inc. and disclaims any commitment or obligation on their part. Any information provided is proprietary and may not be shared without permission. The document also contains forward-looking statements that actual results could differ materially from. Existing and prospective investors, customers, and partners are advised not to rely solely on these statements. Success depends on many factors outside of New Relic's control.Ad
New Relic .NET Agent Overview
- 1. Monitoring .NET Applications with New Relic RPM October 21st, 2010 @ 11AM PST Brian Doll Application Performance Engineer
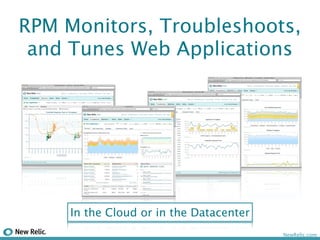
- 2. RPM Monitors, Troubleshoots, and Tunes Web Applications In the Cloud or in the Datacenter NewRelic.com
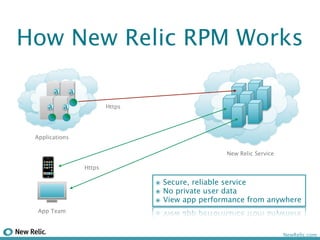
- 3. How New Relic RPM Works a! a! a! a! Https Applications New Relic Service Https Ó╣Å Secure, reliable service Ó╣Å No private user data Ó╣Å View app performance from anywhere App Team NewRelic.com
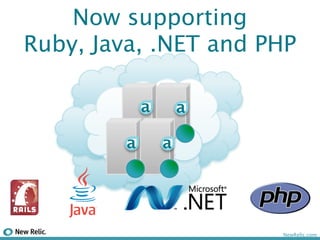
- 4. Now supporting Ruby, Java, .NET and PHP a! a! a! a! NewRelic.com
- 5. LetŌĆÖs get started with the New Relic .NET Agent NewRelic.com
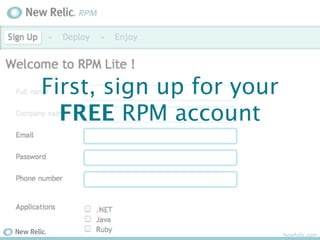
- 6. First, sign up for your FREE RPM account NewRelic.com
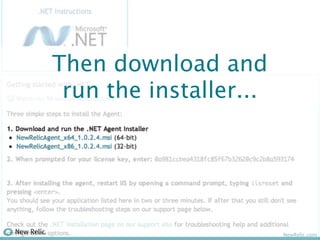
- 7. Then download and run the installer... NewRelic.com
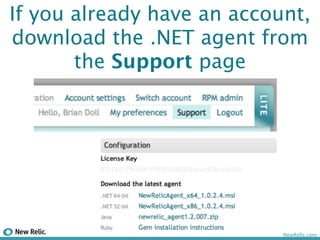
- 8. If you already have an account, download the .NET agent from the Support page NewRelic.com
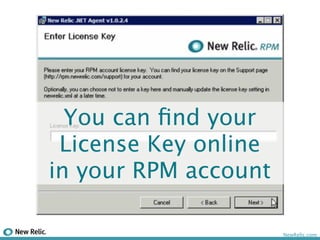
- 9. You can ’¼ünd your License Key online in your RPM account NewRelic.com
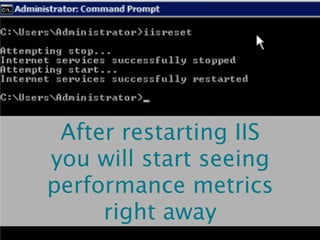
- 10. After restarting IIS you will start seeing performance metrics right away NewRelic.com
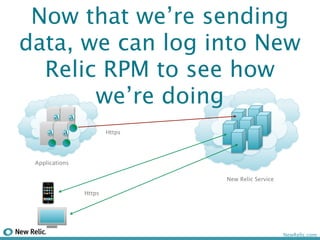
- 11. Now that weŌĆÖre sending data, we can log into New Relic RPM to see how weŌĆÖre doing a! a! a! a! Https Applications New Relic Service Https NewRelic.com
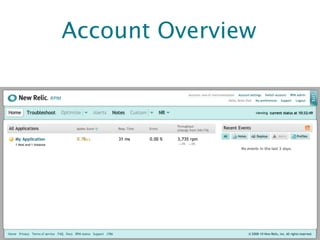
- 12. Account Overview NewRelic.com
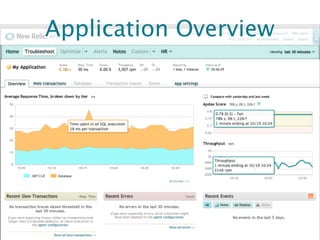
- 13. Application Overview NewRelic.com
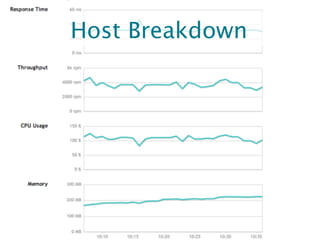
- 14. Host Breakdown NewRelic.com
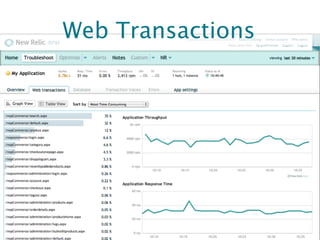
- 15. Web Transactions NewRelic.com
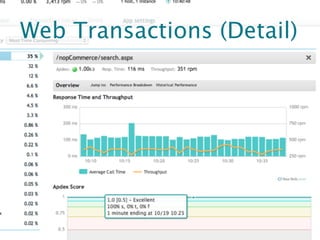
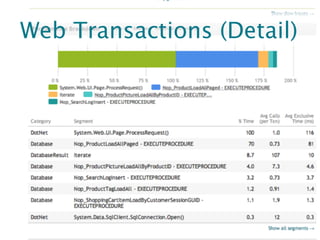
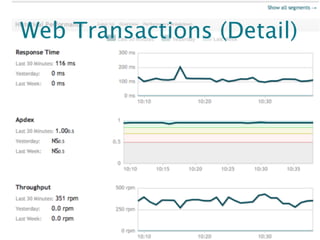
- 16. Web Transactions (Detail) NewRelic.com
- 17. Web Transactions (Detail) NewRelic.com
- 18. Web Transactions (Detail) NewRelic.com
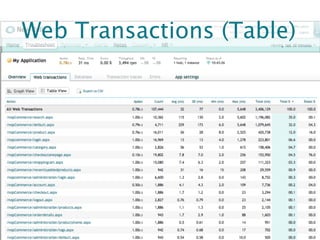
- 19. Web Transactions (Table) NewRelic.com
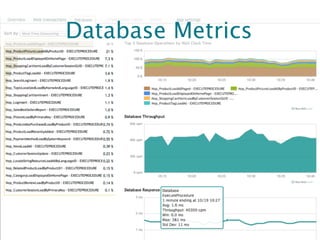
- 20. Database Metrics NewRelic.com
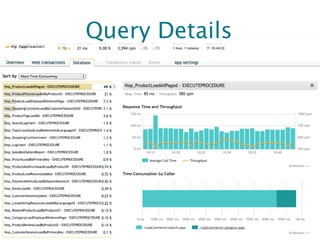
- 21. Query Details NewRelic.com
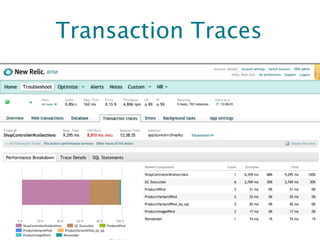
- 22. Transaction Traces NewRelic.com
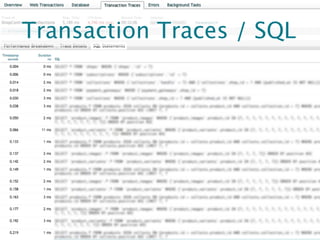
- 23. Transaction Traces / SQL NewRelic.com
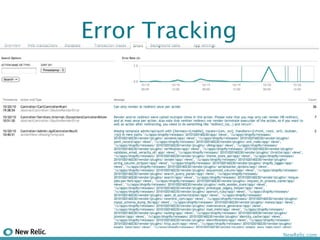
- 24. Error Tracking NewRelic.com
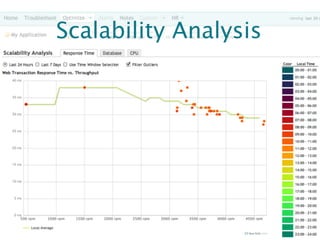
- 25. Scalability Analysis NewRelic.com
- 26. What have we learned? RPM now supports Ruby, Java, .NET and PHP You can begin to see .NET metrics in minutes RPM is awesome and gets more awesome every week Production monitoring of .NET applications will blow you away, and youŌĆÖll wonder how you ever lived without it! NewRelic.com
- 27. Any Questions? Live Q&A during the webinar http://support.newrelic.com/ Email: support@newrelic.com Twitter: @NewRelic IRC: #NewRelic on Freenode NewRelic.com