NIWeek 2011: Five Clever Debugging Techniques for Every LabVIEW Developer
- 1. PUSHING THE LIMITS OF LABVIEW Five Clever Debugging Techniques for Every LabVIEW Developer! Presented at NIWeek 2011! Omar Mussa! Sr. Engineer! http://imgs.xkcd.com/comics/bug.png!
- 2. Avoidance! http://sv.wikipedia.org/wiki/Fil:Transamerica_Pyramid_from_street_level_4.JPG! Architecture! Testing! Issue Tracking! Debugging is not a value added task! PUSHING THE 2 LIMITS OF LABVIEW
- 3. Hidden Costs of Poor Quality! http://sv.wikipedia.org/wiki/Fil:Transamerica_Pyramid_from_street_level_4.JPG! Schedule Delays! Time & Materials! Customer Perception! PUSHING THE 3 LIMITS OF LABVIEW
- 4. JKI Stock Tracker App! Quick Overview! Subtle Bugs! PUSHING THE 4 LIMITS OF LABVIEW
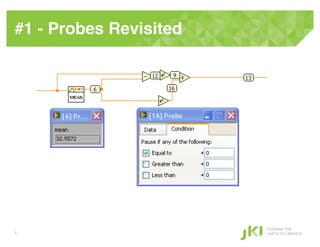
- 5. #1 - Probes Revisited! PUSHING THE 5 LIMITS OF LABVIEW
- 6. #2 - Suspend When Called! Overlooked ? Easy ?to ?use ? http://www.viewzone.com/dead.scroll1.jpg! PUSHING THE 6 LIMITS OF LABVIEW
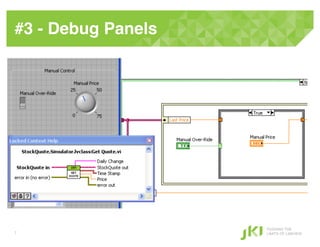
- 7. #3 - Debug Panels! PUSHING THE 7 LIMITS OF LABVIEW
- 8. #4 - Unit Testing! Iden2fy ?+ ??x ?bugs ? Enable ?good ?design ? Long ?term ?solu2on ? http://www.quickmeme.com/meme/2nau! PUSHING THE 8 LIMITS OF LABVIEW
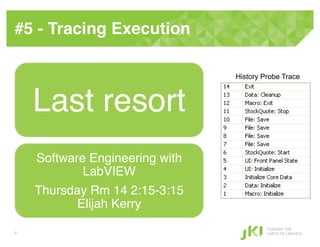
- 9. #5 - Tracing Execution! History Probe Trace Last resort! Software Engineering with LabVIEW ! Thursday Rm 14 2:15-3:15 Elijah Kerry! PUSHING THE 9 LIMITS OF LABVIEW
- 10. Questions! http://www.freeimageslive.co.uk/free_stock_image/interoggatoryquestionmarkjpg PUSHING THE 10 LIMITS OF LABVIEW

