noise experiment
- 1. Noise Experiments Ray Oct 13th, 2015
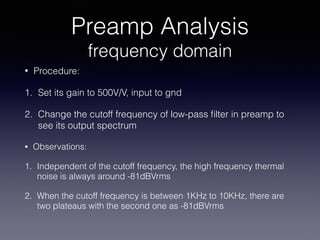
- 2. Preamp Analysis frequency domain âĒ Procedure: 1. Set its gain to 500V/V, input to gnd 2. Change the cutoff frequency of low-pass ïŽlter in preamp to see its output spectrum âĒ Observations: 1. Independent of the cutoff frequency, the high frequency thermal noise is always around -81dBVrms 2. When the cutoff frequency is between 1KHz to 10KHz, there are two plateaus with the second one as -81dBVrms
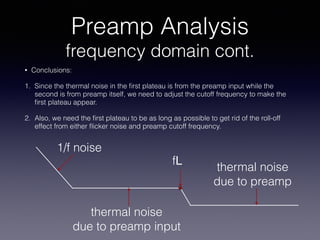
- 3. Preamp Analysis frequency domain cont. âĒ Conclusions: 1. Since the thermal noise in the ïŽrst plateau is from the preamp input while the second is from preamp itself, we need to adjust the cutoff frequency to make the ïŽrst plateau appear. 2. Also, we need the ïŽrst plateau to be as long as possible to get rid of the roll-off effect from either ïŽicker noise and preamp cutoff frequency. 1/f noise thermal noise due to preamp input thermal noise due to preamp fL
- 4. Noise Analysis frequency domain âĒ Measurement Setup: A To Spectrum Analyzer Preamp 1Mohm VGS
- 5. Noise Analysis frequency domain RD VGS Weak Inversion Condition
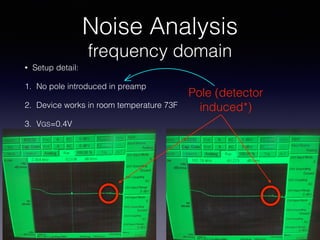
- 6. Noise Analysis frequency domain âĒ Setup detail: 1. No pole introduced in preamp 2. Device works in room temperature 73F 3. VGS=0.4V Pole (detector induced*)
- 7. Noise Analysis Integration Method Pole in preamp: 10Hz 1/f noise dominant
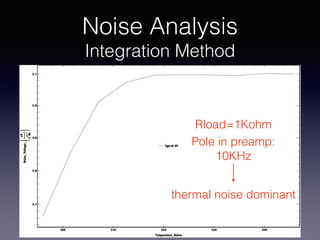
- 10. Noise Analysis Integration Method Pole in preamp: 10KHz thermal noise dominant Rload=1Kohm
- 13. Noise Analysis Integration Method Region 1 Region 2
- 14. Noise Analysis Integration Method âĒ Region 1: 1. noise highly depends on the temperature 2. This temperature dependence is from the channel noise âĒ Region 2: noise is almost independent of the temperature This happens because RD sits outside oven. âĒ No matter what is the reason, measuring temperature from 73F to 83F can tell us the channel noise dependence on the temperature
- 15. Noise Analysis vs Temperature frequency domain T=73F(296K) âĒ After averaging using two frequencies and ïŽve resetting, -55.023 dBVrms noise power spectrum density is derived and it equals to 3.146uV/sqrt(Hz). âĒ Since preamp gain is 500V/V, the equivalent noise spectrum density from the detector is 3.146u/sqrt(500), which is 0.1407uV/sqrt(Hz) fL = 56.5KHz
- 16. Noise Analysis vs Temperature frequency domain T=83F(301.5K) âĒ After averaging using two frequencies and ïŽve resetting, -53.872 dBVrms noise power spectrum density is derived and it equals to 4.1uV/sqrt(Hz). âĒ Since preamp gain is 500V/V, the equivalent noise spectrum density from the detector is 4.1u/sqrt(500), which is 0.18336uV/sqrt(Hz) fL = 47.616KHz
- 17. Noise Analysis vs Temperature frequency domain T=93F(307K) âĒ After averaging using two frequencies and ïŽve resetting, -53.792 dBVrms noise power spectrum density is derived and it equals to 4.1764uV/sqrt(Hz). âĒ Since preamp gain is 500V/V, the equivalent noise spectrum density from the detector is 4.1u/sqrt(500), which is 0.18677uV/sqrt(Hz) fL = 45.4KHz Noise actually drops in this temperature
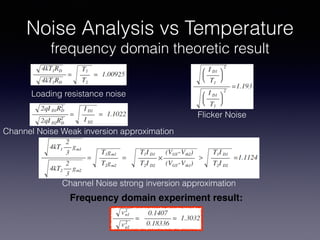
- 18. Noise Analysis vs Temperature frequency domain theoretic result Channel Noise Loading resistance noise Frequency domain experiment result:
- 19. Noise Analysis vs Temperature frequency domain theoretic result Channel Noise Weak inversion approximation Loading resistance noise Flicker Noise Channel Noise strong inversion approximation Frequency domain experiment result:
