


Normal Distribution
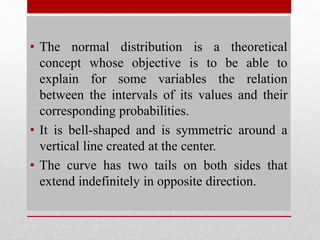
- 2. âĒ The normal distribution is a theoretical concept whose objective is to be able to explain for some variables the relation between the intervals of its values and their corresponding probabilities. âĒ It is bell-shaped and is symmetric around a vertical line created at the center. âĒ The curve has two tails on both sides that extend indefinitely in opposite direction.
- 4. EMPIRICAL RULE FIGURE 1.2 The subdivision of the horizontal axis into equal sub intervals with 1 unit equal to 1 standard devation - 3s - 2s - 1s xĖ 1s 2s 3s
- 5. âĒ FROM FIGURE 1.2, WE SHALL CONSIDER THREE SPECIFIC INTERVALS: 68% (xĖ - 1s) â (xĖ + 1s) 95% (xĖ - 2s) â (xĖ + 2s) 99% (xĖ - 3s) â (xĖ + 3s) Figure 1.3. The Approximate Areas of the Intervals Representing the Empirical Rule. - 3s - 2s - 1s xĖ 1s 2s 3s
- 6. To illustrate the significance of the empirical rule, consider the NCEE scores of the students in a certain college whose mean is 75 and a standard deviation of 8. Assuming normality of the data, then from the empirical rule, we can say that a.) Approximately, 68% of the students in that college have NCEE scores between 75 plus or minus 8, that is, 75 â 1 (8) - 75 + 1 (8) (75 â 8) â (75 + 8) 67 - 83
- 7. b.) Approximately, 95% of the students in that college have NCEE scores between 75 plus minus 2 times the standard deviation, 8. Thus, 75 â 2 (8) â 75 + 2 (8) 75 â 16 â 75 + 16 59 â 91 c.) Approximately, 99% of the students in that college have NCEE scores of 75 plus or minus 3 times the standard deviation, 8. Thus, 75 â 3 (8) â 75 + 3 (8) 75 â 24 â 75 + 24 51 - 99
- 8. Figure 1.4 The Graph of the NCEE Scores of the Students in a Certain College. The Length of the Subinterval is equal to 1 Standard Deviation. We can now present the data under the normal curve area where the horizontal axis is divided into equal sub intervals. 51 59 67 75 83 91 99
- 9. STANDARD or the Z - The standard score z represents a normal distribution with mean xĖ = 0 and a standard deviation s = 1. Such transformation can be obtained by using the formula below. z = x - xĖ s SCORE
- 10. GET READY FOR AN EXERCISE
- 11. The average efficiency rating of the faculty members of a certain university is 85 with a standard deviation of 4. ANSWER: 73 77 81 85 89 93 97 PRESENT THE DATA UNDER A NORMAL CURVE AREA WHERE THE HORIZONTAL AXIS IS DIVIDED INTO EQUAL SUBINTERVALS.
- 12. By using the standard score, the values 73, 77, 81, 85 and so on can be transformed into the standard scores by using this equation: z = x - xĖ s To illustrate, suppose x = 85 and s = 4 x = 81 and s = 4 z = 85 â 85 z = 81 - 85 4 4 = 0 = -4 4 = - 1
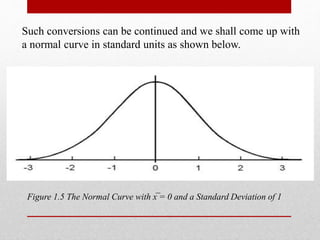
- 13. Such conversions can be continued and we shall come up with a normal curve in standard units as shown below. Figure 1.5 The Normal Curve with xĖ = 0 and a Standard Deviation of 1
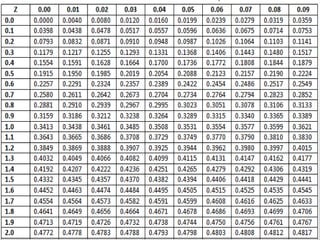
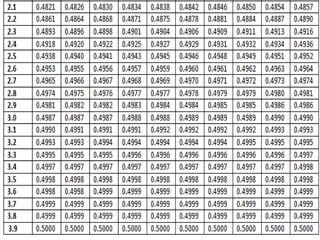
- 14. NORMAL CURVE AREAS The total area under the normal curve is equal to 1. Since a normally distributed set of data is symmetric, then the total area from z = 0 to the right is equal to 0.5. the area under the curve of any two points in a horizontal scale can be obtained with Table 1.1. Such values of z can be positive or negative but the area under the curve will always be positive.
- 17. 1.25 .3944
- 18. Note that Table 1.1 has no negative values for z. It does not mean, however, that the area under the curve which is to the left of zero cannot be determined. Such area can still be obtained due to the symmetric property of the normal curve. Hence, we can say that the area under the curve from z = 0 to z = -1.25 is also equal to .3944. Also, the interval represented by z = 0 to z = -1.25 is symbolized as -1. 25 < z < 0. It was mentioned earlier that the total area under the curve is equal to 1. Thus, we can associate these areas under the normal curve as probabilities.
- 19. Generally, the capital letter Z is used to represent a certain event that is greater than a standard score represented by small letter z. Such event is denoted by Z > z. An event that is less than a standard score shall be denoted b Z < z. To determine the area under the curve or the probability of the event, we shall use the notations P(Z > z), P(Z < z), and P( z1 < Z < z2).
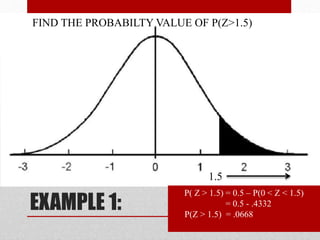
- 20. Solution: To be able to have a clear picture of the area under the normal curve, it is important that the said area be identified through the graph. EXAMPLE 1: FIND THE PROBABILTY VALUE OF P(Z>1.5) 1.5 P( Z > 1.5) = 0.5 â P(0 < Z < 1.5) = 0.5 - .4332 P(Z > 1.5) = .0668
- 21. EXAMPLE 2: FIND THE PROBABILITY VALUE OF P(Z < -0.5) -0.5 Solution: P(Z < -0.5) = .5 â P(0 < Z < -.5) = .5 - .1915 P(Z < -0.5) = .3085
- 22. EXAMPLE 3: FIND THE PROBABILITY VALUE OF P( -.5 < Z < 1.5) -0.5 1.5 P (-.5 < Z < 1.5) = P(0 < Z < 0.5) + P (0 < Z < 1.5) = .1915 + .4332 P (-.5 < Z < 1.5) = .6247
- 23. EXAMPLE 4: FIND THE PROBABILITY VALUE OF P(1.25 < Z < 2.31) 1.25 2.31 P(1.25 < Z < 2.31) = P (0 < Z < 2.31) â (0 < Z < 1.25) = .4896 - .3944 P(1.25 < Z < 2.31) = .0952
- 24. EXAMPLE 5: COMPUTE THE PROBABILITY OF P(Z < 1.25) 1.25 P (Z < 1.25) = 0.5 + P (0 < Z < 1.25) = 0.5 + .3944 P (Z < 1.25) = .8944
- 25. GET READY FOR A QUIZ !! ï
- 26. The examination results of a large group of students in statistics are approximately normally distributed with a mean of 60 and a standard deviation of 9. If a student is chosen at random , what is the probability that his score is? 1.) below 45? 2.) above 73? 3.) below 85? 4.) between 50 and 75? LOOK FOR THE STANDARD SCORE AND PROBABILITY
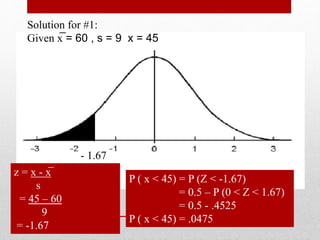
- 27. Solution for #1: Given xĖ = 60 , s = 9 x = 45 z = x - xĖ s = 45 â 60 9 = -1.67 P ( x < 45) = P (Z < -1.67) = 0.5 â P (0 < Z < 1.67) = 0.5 - .4525 P ( x < 45) = .0475 - 1.67