


![[ëíëīėž20ëė°ęĩŽė] 2017 20ë ėĻëžėļė ëģī ėīėĐíí ë° ėļėėĄ°ėŽ (ė°ęĩŽëĶŽíŽíļ 2017-05)](https://cdn.slidesharecdn.com/ss_thumbnails/201720report-170726013104-thumbnail.jpg?width=560&fit=bounds)


![[ëíëīėž20ëė°ęĩŽė] 2017 ëíė ë°ĐííęĩŽėí(ė°ęĩŽëĶŽíŽíļ 2017-13)](https://cdn.slidesharecdn.com/ss_thumbnails/202017fnv2-171201002929-thumbnail.jpg?width=560&fit=bounds)


![[ëíëīėž20ëė°ęĩŽė] 2017 ėŽė ëíėė ëŽëžė§ ėę°ė ė―ëĪ (ė°ęĩŽëĶŽíŽíļ 2017-11)](https://cdn.slidesharecdn.com/ss_thumbnails/2017-170816011430-thumbnail.jpg?width=560&fit=bounds)

![[ëíëīėž20ëė°ęĩŽė] ęĩëī ėĪęĩėļ ė íė ëíė ëėļíë ė°ļėŽ ėĪí ë° ėļė ėĄ°ėŽ (ė°ęĩŽëĶŽíŽíļ 2016-12)](https://cdn.slidesharecdn.com/ss_thumbnails/202016-12-170106080744-thumbnail.jpg?width=560&fit=bounds)


More Related Content
What's hot (20)
Similar to Nps list (20)


Recently uploaded (20)


Nps list
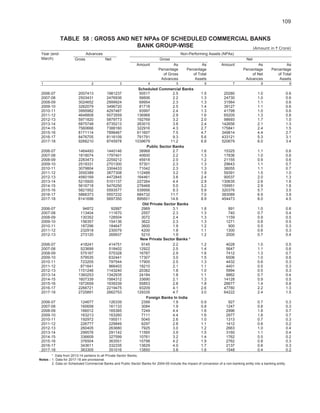
- 1. 109 TABLE 58 : GROSS AND NET NPAs OF SCHEDULED COMMERCIAL BANKS BANK GROUP-WISE (Amount in ` Crore) Year (end- March) Advances Non-Performing Assets (NPAs) Gross Net Gross Net Amount As Percentage of Gross Advances As Percentage of Total Assets Amount As Percentage of Net Advances As Percentage of Total Assets 1 2 3 4 5 6 7 8 9 2006-07 2007413 1981237 50517 2.5 1.5 20280 1.0 0.6 2007-08 2503431 2476936 56606 2.2 1.3 24730 1.0 0.6 2008-09 3024652 2999924 69954 2.3 1.3 31564 1.1 0.6 2009-10 3262079 3496720 81718 2.5 1.4 39127 1.1 0.6 2010-11 3995982 4297487 93997 2.4 1.3 41799 1.0 0.6 2011-12 4648808 5073559 136968 2.9 1.6 65205 1.3 0.8 2012-13 5971820 5879773 192769 3.2 2.0 98693 1.7 1.0 2013-14 6875748 6735213 263015 3.8 2.4 142656 2.1 1.3 2014-15 7560666 7388160 322916 4.3 2.7 175841 2.4 1.5 2015-16 8171114 7896467 611607 7.5 4.7 349814 4.4 2.7 2016-17 8476705 8116109 791791 9.3 5.6 433121 5.3 3.1 2017-18 9266210 8745978 1039679 11.2 6.8 520679 6.0 3.4 2006-07 1464493 1440146 38968 2.7 1.6 15325 1.1 0.6 2007-08 1819074 1797401 40600 2.2 1.3 17836 1.0 0.6 2008-09 2283473 2259212 45918 2.0 1.2 21155 0.9 0.6 2009-10 2519331 2701300 57301 2.3 1.3 29643 1.1 0.7 2010-11 3079804 3304433 71042 2.3 1.3 36055 1.1 0.7 2011-12 3550389 3877308 112488 3.2 1.9 59391 1.5 1.0 2012-13 4560169 4472845 164461 3.6 2.4 90037 2.0 1.3 2013-14 5215920 5101137 227264 4.4 2.9 130635 2.6 1.6 2014-15 5616718 5476250 278468 5.0 3.2 159951 2.9 1.8 2015-16 5821952 5593577 539956 9.3 5.9 320376 5.7 3.5 2016-17 5866373 5557232 684732 11.7 7.0 383089 6.9 3.9 2017-18 6141698 5697350 895601 14.6 8.9 454473 8.0 4.5 2006-07 94872 92887 2969 3.1 1.8 891 1.0 0.6 2007-08 113404 111670 2557 2.3 1.3 740 0.7 0.4 2008-09 130352 128504 3072 2.4 1.3 1159 0.9 0.5 2009-10 156357 154136 3622 2.3 1.3 1271 0.8 0.5 2010-11 187296 184647 3600 1.9 1.2 900 0.5 0.3 2011-12 232918 230079 4200 1.8 1.1 1300 0.6 0.3 2012-13 273120 269937 5210 1.9 1.2 2000 0.7 0.4 2006-07 418241 414751 9145 2.2 1.2 4028 1.0 0.5 2007-08 523699 518402 12922 2.5 1.4 5647 1.1 0.6 2008-09 575167 575328 16787 2.9 1.6 7412 1.3 0.7 2009-10 579535 632441 17307 3.0 1.5 6506 1.0 0.6 2010-11 723205 797544 17905 2.5 1.3 4432 0.6 0.3 2011-12 871641 966403 18210 2.1 1.1 4401 0.5 0.3 2012-13 1151246 1143240 20382 1.8 1.0 5994 0.5 0.3 2013-14 1360253 1342935 24184 1.8 1.1 8862 0.7 0.4 2014-15 1607339 1584312 33690 2.1 1.3 14128 0.9 0.5 2015-16 1972659 1939339 55853 2.8 1.8 26677 1.4 0.8 2016-17 2266721 2219475 93209 4.1 2.6 47780 2.2 1.3 2017-18 2725891 2662753 129335 4.7 3.0 64222 2.4 1.5 2006-07 124677 126339 2399 1.9 0.9 927 0.7 0.3 2007-08 160658 161133 3084 1.9 0.8 1247 0.8 0.3 2008-09 166012 165385 7249 4.4 1.6 2996 1.8 0.7 2009-10 163213 163260 7111 4.4 1.6 2977 1.8 0.7 2010-11 192972 195511 5045 2.6 1.0 1313 0.7 0.3 2011-12 226777 229849 6297 2.8 1.1 1412 0.6 0.2 2012-13 260405 263680 7925 3.0 1.2 2663 1.0 0.4 2013-14 299576 291142 11565 3.9 1.5 3160 1.1 0.4 2014-15 336609 327599 10761 3.2 1.4 1762 0.5 0.2 2015-16 376504 363551 15798 4.2 1.9 2762 0.8 0.3 2016-17 343611 332335 13629 4.0 1.7 2137 0.6 0.3 2017-18 363305 351016 13850 3.8 1.6 1548 0.4 0.2 Scheduled Commercial Banks Public Sector Banks Old Private Sector Banks New Private Sector Banks * Foreign Banks In India Notes : * Data from 2013-14 pertains to all Private Sector Banks. 1. Data for 2017-18 are provisional. 2. Data on Scheduled Commercial Banks and Public Sector Banks for 2004-05 include the impact of conversion of a non-banking entity into a banking entity.