OEE PRESENTATION
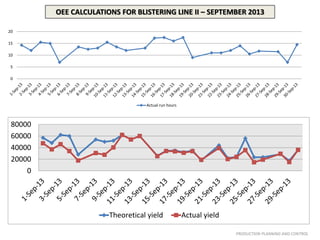
- 1. 0 5 10 15 20 Actual run hours 0 20000 40000 60000 80000 Theoretical yield Actual yield OEE CALCULATIONS FOR BLISTERING LINE II – SEPTEMBER 2013 PRODUCTION PLANNING AND CONTROL
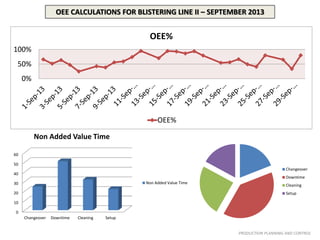
- 2. 0 10 20 30 40 50 60 Changeover Downtime Cleaning Setup Non Added Value Time Non Added Value Time Changeover Downtime Cleaning Setup OEE CALCULATIONS FOR BLISTERING LINE II – SEPTEMBER 2013 0% 50% 100% OEE% OEE% PRODUCTION PLANNING AND CONTROL


