OIR - UT Freshman Class Presentation
Download as pptx, pdf1 like316 views
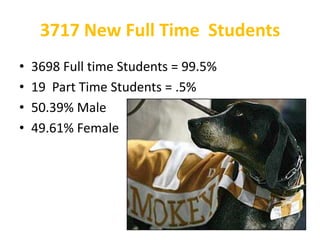
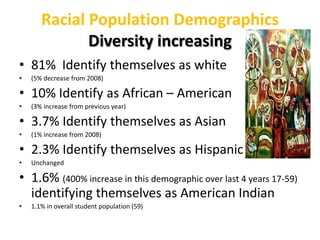
The freshman class of 2009 at the University of Tennessee - Knoxville consisted of 3717 new full-time students and 19 part-time students. The class was 50.39% male and 49.61% female. The racial demographics showed an increase in diversity, with 81% identifying as white, 10% African American, 3.7% Asian, and 2.3% Hispanic. The average ACT score was 26.4, above the national average. Most freshmen were 18 years old, had a high school GPA between 3.0-3.5, and were Tennessee residents. The three largest colleges that freshmen enrolled in were Arts & Sciences, Undeclared, and Business Administration.
1 of 11
Download to read offline

Ad
Recommended
Facts on Right to Education
Facts on Right to EducationTejwinder Anand
╠²
The document summarizes statistics on children out of school in India from various reports between 2005 and 2009. It finds that children from marginalized communities have higher dropout rates but there has been significant improvement over time. Primary completion rates and gender parity in education increased substantially from 1991 to 2006 according to UN data. However, attendance and learning achievement levels still need more focus, particularly in the transition to secondary education.RERC north-carolina
RERC north-carolinaMebane Rash
╠²
This document is a racial equity report card for North Carolina that provides data on demographic statistics and metrics in education and juvenile justice. Some key findings include:
- White and Asian students have higher rates of being deemed "college and career ready" based on standardized test scores compared to Hispanic, Black, American Indian and multiracial students.
- Black students receive suspensions, both short-term and long-term, at much higher rates than other groups. They also have higher rates of juvenile complaints, detentions and commitments to youth detention centers.
- The report card is produced by the Youth Justice Project to evaluate racial disparities in education and juvenile systems in order to identify causes and solutions to racial inequity.Telefonica 2014 Global Millennial Survey Section 5 - Education Concerns
Telefonica 2014 Global Millennial Survey Section 5 - Education ConcernsPaul Fabretti
╠²
The Telef├│nica Global Millennial Survey highlights millennials' dissatisfaction with the education systems in various regions, particularly Latin America, where quality is a major concern. The survey, which included 6,702 interviews across 18 countries, found that millennials emphasize the importance of studying healthcare, STEM fields, and business for future success. Improvements in education access are linked to technology, with significant support for enhancing educational infrastructure.Altc 2010 paper_0188_cb_dh
Altc 2010 paper_0188_cb_dhClaire B
╠²
This document summarizes research into first-year business students' use of mobile phones for learning. Surveys from 2005-2009 found that nearly all students had camera phones and internet access. Attitude surveys showed most students felt mobile learning was important. Usage data revealed growing use of phones for research, content generation, and accessing course materials. The researchers concluded mobile phones are now ubiquitous among students and future work should focus on how students leverage these devices for educational tasks.Presentation for donor mission 2007 December
Presentation for donor mission 2007 DecemberRoshan Chitrakar
╠²
The document summarizes findings from a longitudinal study that tracked students in 62 schools over 5 years from 2002-2006. It found that about half of students progressed through all 5 grades, while about half left school early. Students with early childhood education backgrounds had higher promotion rates than those without. Promotion and survival rates varied by gender, caste, ethnicity and region. The study established a database to analyze trends in student promotion, repetition and dropout over time.Psy final project
Psy final projectchiasueyi
╠²
The document summarizes the results of a survey with the following key findings:
1. The average age of participants was between 19-24 years old.
2. Most participants were single (68%), with smaller percentages being in a relationship (28%) or married (3%).
3. Chinese participants predominantly had friends that were 95% the same race, while other races like Indian and Malay had more diverse friend groups with only 50-95% being the same race.
4. Chinese participants predominantly preferred partners with yellow skin color, while Indian and Malay participants preferred light and dark brown skin tones.
5. Chinese participants predominantly preferred partners from Southeast Asia, while other groups showed preferences forActive Commuting and School Choice Policy
Active Commuting and School Choice PolicyChris Pulley, MPH, CPH
╠²
This document examines active commuting in a district with a school choice policy, focusing on factors influencing students' transportation modes to school. The study analyzes demographic variables, school type, and distance to school, finding a prevalence of active commuting above the national average, particularly in high minority schools. Limitations of the study include a limited number of observations and the lack of assessment of built environment characteristics.E0364026030
E0364026030inventionjournals
╠²
The document presents a study on the utilization of online databases by PGDM students at the Institute for Financial Management and Research (IFMR), Chennai, aiming to assess their awareness, skills, and the challenges faced in accessing these resources. Results indicate that while 87.66% of respondents are familiar with online databases, issues such as lack of support from library staff and a need for training are prevalent. The study concludes with recommendations for improved access and training to enhance the effective use of online databases among students.General Community Colleges
General Community Collegesfredcosgrove
╠²
Community colleges have grown rapidly since WWII and now serve 33% of US higher education students. They are responsive to local community needs and serve nontraditional students. In the 1980s, enrollment growth slowed as the student population changed. However, community colleges adapted by offering retraining programs and increasing flexibility. They have also strengthened transfer pathways to 4-year schools and diversified their faculty. Moving forward, community colleges are expected to play a larger role in serving underrepresented groups and addressing teacher shortages through lateral entry programs in partnership with other institutions.Academic Recruiting Issues 2010
Academic Recruiting Issues 2010fredcosgrove
╠²
This document discusses strategies for effectively recruiting new students. It recommends reaching prospective students through a variety of preferred venues and capturing their interest by making the college experience feel real and personal. Recruiters must accommodate different communication styles and stratify their messages for different audiences. They should also consider recruiting efforts to reach diverse groups of students like home-schooled students and non-traditional students to boost retention rates. Having an appealing, multi-functional website that is linked everywhere prospective students are online is also recommended.Executing projects
Executing projectsbenedick ledesma
╠²
The document discusses key processes for executing projects, including acquiring and developing the project team through training and rewards, managing communications through interactive, push, and pull methods, and conducting procurement by obtaining seller responses, selecting sellers, and administering contracts to complete portions of the project work.Mandate, sovereignty
Mandate, sovereigntybenedick ledesma
╠²
The document discusses several key concepts related to political ideologies and theories:
1. It defines Marxism as a socioeconomic and political ideology based on the theories of Karl Marx that analyzes the development of capitalism and class struggle.
2. It outlines the three phases Marx described for achieving a classless, stateless utopian society: revolution, dictatorship, and utopia.
3. It lists some key tenets of Marxism including a central banking system, government control of education, labor, transportation, communication, agriculture, and factories, and the abolition of private property.The Professional Bureaucracy
The Professional Bureaucracyfredcosgrove
╠²
The professional bureaucracy is characterized by standardized work processes and decentralized decision making. Professionals such as teachers, doctors, and case workers work independently with their clients but coordinate with their peers. Their work is governed by standards set by external organizations. While work processes are complex, professionals exercise judgment within established guidelines. Administrators organize professionals by client type and coordinate their work while respecting professional autonomy. Attempts to impose external controls can undermine professional standards and dampen innovation. Gradual change through professional associations may be most effective.Other examples of adhocracy
Other examples of adhocracybenedick ledesma
╠²
- A task force is a temporary organizational structure formed to accomplish a specific, well-defined, and complex task involving multiple sub-units. Members serve until the goal is achieved, then the task force disbands.
- A task force draws on expertise from different departments to guide decision making and ensure all perspectives are considered. It turns the operation into a cooperative effort with more chances of success.
- A permanent committee facilitates diverse inputs like a task force but also has the stability of a matrix structure. It oversees critical functions and brings different perspectives into top-level decision making.Justice
Justicebenedick ledesma
╠²
Justice refers to fairness and equality under the law. It is a complex concept with various understandings and definitions. The document discusses definitions of justice, types of justice including distributive, compensatory, retributive, and social justice. It also examines the criminal justice system as consisting of five pillars - law enforcement, prosecution, judiciary, corrections, and community involvement - working together to investigate crimes, prosecute offenders, and rehabilitate criminals.Sources of funds for the national government
Sources of funds for the national governmentbenedick ledesma
╠²
The document discusses the sources of funds for the National Government which include tax revenues, non-tax revenues, borrowings, and withdrawals from cash balances. It provides details on different types of taxes and non-tax revenues. It also explains the purpose of government borrowings from domestic and foreign sources. The document then discusses the different dimensions of the national budget such as sectors, cost structures, expense classes, major recipients, and regional allocations. It concludes by outlining the process of creating pork barrel funds through the preparation, authorization, and execution of the national budget.2011 SAIR It's not about pie when it comes to the facts
2011 SAIR It's not about pie when it comes to the factsDavid Onder
╠²
The document discusses data visualization principles applied to academic admissions data, emphasizing clarity and effective communication to stakeholders. It presents trends related to freshman applicants, acceptances, and enrollment over several years, with a focus on demographic changes. Various visualization techniques and statistical methods are suggested, alongside resources for further design guidance.September 2019 Division Meeting
September 2019 Division MeetingUniversity of South Carolina Division of Student Affairs and Academic Support
╠²
The document provides an overview of the state of the Division of Student Affairs at the University of South Carolina. It discusses enrollment trends which show increasing class sizes, ACT scores, and retention of South Carolina students. Freshman profiles for the upcoming year indicate a class of over 6,200 students with average SAT of 1273 and ACT of 28. Retention and graduation rates are provided in comparison to peer institutions. Diversity statistics show increases in underrepresented minority students and degrees awarded. The values and strategic priorities of the division are outlined which focus on student success, diversity and inclusion.Using Data and Predictive Analytics to Help At-Risk Students
Using Data and Predictive Analytics to Help At-Risk StudentsAtlanta Connected Learning
╠²
The document discusses strategies employed by Georgia State University to improve the success of at-risk students through data and predictive analytics. Key interventions include targeted summer programs, learning communities, financial support through grants, and a web-based GPS advising system that monitors student performance and progress. These initiatives have significantly increased student retention and graduation rates, particularly among underrepresented groups.Tableau whitepaper
Tableau whitepaperTodd Wirsching, PMP
╠²
The document discusses how universities are using data and analytics to communicate important information about their institutions. It provides examples of 8 ways universities present data online, such as tracking enrollment trends over time, creating interactive factbooks with information for prospective students, and showing progress on metrics like graduation rates to attract donors. The examples show how visualizing data in online dashboards allows universities to better engage with students, faculty, and the public.Sample data presentation
Sample data presentationmarlaphillips3
╠²
This document summarizes data from Glencliff High School in Tennessee from 2010. It shows that the school has highly diverse student body from 44 countries speaking 40 languages. It also shows improvements in freshman promotion rates since implementing a Freshman Academy. Additional data outlines the school's performance, demographics, attendance, mobility, and Adequate Yearly Progress history. Scores on state standardized tests and ACT exams are provided. Throughout, the importance of recognizing the individual students behind the data is emphasized.Recruiting and Retaining First Generation and Diverse students
Recruiting and Retaining First Generation and Diverse studentsBen Webb, MBA
╠²
The document discusses strategies for recruiting and retaining first-generation and diverse students in higher education, highlighting the importance of understanding their unique challenges and support needs. It identifies key factors for attraction and retention, such as financial aid, mentoring, community involvement, and academic support. Additionally, it outlines both opportunities and challenges that institutions face in addressing the needs of these populations.UK STEM Conference, February 19, 2010
UK STEM Conference, February 19, 2010University of Kentucky
╠²
This document summarizes strategies for improving student transitions from high school to the University of Kentucky (UK). It discusses UK's emphasis on placement strategies in math, English, and science courses to help ensure student success. The document also outlines factors that correlate with retention, such as student expectations, study time, social engagement, and academic fit. Students who earn strong high school GPAs and take Advanced Placement courses tend to be more successful in their first year at UK. The document recommends collaboration between high schools and UK to help prepare students and address barriers to success.Trends in International Student Enrollment in the U.S.: Open Doors 2012
Trends in International Student Enrollment in the U.S.: Open Doors 2012Marty Bennett
╠²
The Open Doors® 2012 report indicates a 6% increase in international student enrollment in the U.S., reaching a record high of 764,495 students, with China, India, South Korea, and Saudi Arabia as the top origins. Undergraduate students now outnumber graduate students for the first time since 2000, and business and STEM fields dominate the fields of study. The report highlights increasing financial contributions of international students to the U.S. economy, totaling over $22.7 billion, and ongoing growth in enrollments for fall 2012.DU 2010 Faculty Staff Institute 08 18 10 State of Student Success
DU 2010 Faculty Staff Institute 08 18 10 State of Student SuccessDillard University Library
╠²
The document discusses the state of student success at a university, including enrollment goals, recruitment efforts, and retention strategies. Specifically, it outlines the following:
1. Enrollment goals to increase overall enrollment over the next 5 years through recruiting new students and retaining current students at higher rates.
2. Recruitment efforts targeting specific states, schools, and majors based on historical data in order to meet enrollment number goals.
3. Retention strategies including participating in a collaborative initiative to improve graduation rates, setting a goal to improve retention rates 1% per year over 5 years, and providing student support services.Das presentation 2011
Das presentation 2011harrindl
╠²
1) The document discusses developing data to assess student progression at the Los Angeles Community College District.
2) It presents research questions about the progress of first-time students placed in basic skills math, including whether progress varies by ethnicity.
3) Tables show outcomes like course completion rates over three years for different ethnic groups of students placed in basic skills math.More Related Content
Viewers also liked (8)
General Community Colleges
General Community Collegesfredcosgrove
╠²
Community colleges have grown rapidly since WWII and now serve 33% of US higher education students. They are responsive to local community needs and serve nontraditional students. In the 1980s, enrollment growth slowed as the student population changed. However, community colleges adapted by offering retraining programs and increasing flexibility. They have also strengthened transfer pathways to 4-year schools and diversified their faculty. Moving forward, community colleges are expected to play a larger role in serving underrepresented groups and addressing teacher shortages through lateral entry programs in partnership with other institutions.Academic Recruiting Issues 2010
Academic Recruiting Issues 2010fredcosgrove
╠²
This document discusses strategies for effectively recruiting new students. It recommends reaching prospective students through a variety of preferred venues and capturing their interest by making the college experience feel real and personal. Recruiters must accommodate different communication styles and stratify their messages for different audiences. They should also consider recruiting efforts to reach diverse groups of students like home-schooled students and non-traditional students to boost retention rates. Having an appealing, multi-functional website that is linked everywhere prospective students are online is also recommended.Executing projects
Executing projectsbenedick ledesma
╠²
The document discusses key processes for executing projects, including acquiring and developing the project team through training and rewards, managing communications through interactive, push, and pull methods, and conducting procurement by obtaining seller responses, selecting sellers, and administering contracts to complete portions of the project work.Mandate, sovereignty
Mandate, sovereigntybenedick ledesma
╠²
The document discusses several key concepts related to political ideologies and theories:
1. It defines Marxism as a socioeconomic and political ideology based on the theories of Karl Marx that analyzes the development of capitalism and class struggle.
2. It outlines the three phases Marx described for achieving a classless, stateless utopian society: revolution, dictatorship, and utopia.
3. It lists some key tenets of Marxism including a central banking system, government control of education, labor, transportation, communication, agriculture, and factories, and the abolition of private property.The Professional Bureaucracy
The Professional Bureaucracyfredcosgrove
╠²
The professional bureaucracy is characterized by standardized work processes and decentralized decision making. Professionals such as teachers, doctors, and case workers work independently with their clients but coordinate with their peers. Their work is governed by standards set by external organizations. While work processes are complex, professionals exercise judgment within established guidelines. Administrators organize professionals by client type and coordinate their work while respecting professional autonomy. Attempts to impose external controls can undermine professional standards and dampen innovation. Gradual change through professional associations may be most effective.Other examples of adhocracy
Other examples of adhocracybenedick ledesma
╠²
- A task force is a temporary organizational structure formed to accomplish a specific, well-defined, and complex task involving multiple sub-units. Members serve until the goal is achieved, then the task force disbands.
- A task force draws on expertise from different departments to guide decision making and ensure all perspectives are considered. It turns the operation into a cooperative effort with more chances of success.
- A permanent committee facilitates diverse inputs like a task force but also has the stability of a matrix structure. It oversees critical functions and brings different perspectives into top-level decision making.Justice
Justicebenedick ledesma
╠²
Justice refers to fairness and equality under the law. It is a complex concept with various understandings and definitions. The document discusses definitions of justice, types of justice including distributive, compensatory, retributive, and social justice. It also examines the criminal justice system as consisting of five pillars - law enforcement, prosecution, judiciary, corrections, and community involvement - working together to investigate crimes, prosecute offenders, and rehabilitate criminals.Sources of funds for the national government
Sources of funds for the national governmentbenedick ledesma
╠²
The document discusses the sources of funds for the National Government which include tax revenues, non-tax revenues, borrowings, and withdrawals from cash balances. It provides details on different types of taxes and non-tax revenues. It also explains the purpose of government borrowings from domestic and foreign sources. The document then discusses the different dimensions of the national budget such as sectors, cost structures, expense classes, major recipients, and regional allocations. It concludes by outlining the process of creating pork barrel funds through the preparation, authorization, and execution of the national budget.Similar to OIR - UT Freshman Class Presentation (10)
2011 SAIR It's not about pie when it comes to the facts
2011 SAIR It's not about pie when it comes to the factsDavid Onder
╠²
The document discusses data visualization principles applied to academic admissions data, emphasizing clarity and effective communication to stakeholders. It presents trends related to freshman applicants, acceptances, and enrollment over several years, with a focus on demographic changes. Various visualization techniques and statistical methods are suggested, alongside resources for further design guidance.September 2019 Division Meeting
September 2019 Division MeetingUniversity of South Carolina Division of Student Affairs and Academic Support
╠²
The document provides an overview of the state of the Division of Student Affairs at the University of South Carolina. It discusses enrollment trends which show increasing class sizes, ACT scores, and retention of South Carolina students. Freshman profiles for the upcoming year indicate a class of over 6,200 students with average SAT of 1273 and ACT of 28. Retention and graduation rates are provided in comparison to peer institutions. Diversity statistics show increases in underrepresented minority students and degrees awarded. The values and strategic priorities of the division are outlined which focus on student success, diversity and inclusion.Using Data and Predictive Analytics to Help At-Risk Students
Using Data and Predictive Analytics to Help At-Risk StudentsAtlanta Connected Learning
╠²
The document discusses strategies employed by Georgia State University to improve the success of at-risk students through data and predictive analytics. Key interventions include targeted summer programs, learning communities, financial support through grants, and a web-based GPS advising system that monitors student performance and progress. These initiatives have significantly increased student retention and graduation rates, particularly among underrepresented groups.Tableau whitepaper
Tableau whitepaperTodd Wirsching, PMP
╠²
The document discusses how universities are using data and analytics to communicate important information about their institutions. It provides examples of 8 ways universities present data online, such as tracking enrollment trends over time, creating interactive factbooks with information for prospective students, and showing progress on metrics like graduation rates to attract donors. The examples show how visualizing data in online dashboards allows universities to better engage with students, faculty, and the public.Sample data presentation
Sample data presentationmarlaphillips3
╠²
This document summarizes data from Glencliff High School in Tennessee from 2010. It shows that the school has highly diverse student body from 44 countries speaking 40 languages. It also shows improvements in freshman promotion rates since implementing a Freshman Academy. Additional data outlines the school's performance, demographics, attendance, mobility, and Adequate Yearly Progress history. Scores on state standardized tests and ACT exams are provided. Throughout, the importance of recognizing the individual students behind the data is emphasized.Recruiting and Retaining First Generation and Diverse students
Recruiting and Retaining First Generation and Diverse studentsBen Webb, MBA
╠²
The document discusses strategies for recruiting and retaining first-generation and diverse students in higher education, highlighting the importance of understanding their unique challenges and support needs. It identifies key factors for attraction and retention, such as financial aid, mentoring, community involvement, and academic support. Additionally, it outlines both opportunities and challenges that institutions face in addressing the needs of these populations.UK STEM Conference, February 19, 2010
UK STEM Conference, February 19, 2010University of Kentucky
╠²
This document summarizes strategies for improving student transitions from high school to the University of Kentucky (UK). It discusses UK's emphasis on placement strategies in math, English, and science courses to help ensure student success. The document also outlines factors that correlate with retention, such as student expectations, study time, social engagement, and academic fit. Students who earn strong high school GPAs and take Advanced Placement courses tend to be more successful in their first year at UK. The document recommends collaboration between high schools and UK to help prepare students and address barriers to success.Trends in International Student Enrollment in the U.S.: Open Doors 2012
Trends in International Student Enrollment in the U.S.: Open Doors 2012Marty Bennett
╠²
The Open Doors® 2012 report indicates a 6% increase in international student enrollment in the U.S., reaching a record high of 764,495 students, with China, India, South Korea, and Saudi Arabia as the top origins. Undergraduate students now outnumber graduate students for the first time since 2000, and business and STEM fields dominate the fields of study. The report highlights increasing financial contributions of international students to the U.S. economy, totaling over $22.7 billion, and ongoing growth in enrollments for fall 2012.DU 2010 Faculty Staff Institute 08 18 10 State of Student Success
DU 2010 Faculty Staff Institute 08 18 10 State of Student SuccessDillard University Library
╠²
The document discusses the state of student success at a university, including enrollment goals, recruitment efforts, and retention strategies. Specifically, it outlines the following:
1. Enrollment goals to increase overall enrollment over the next 5 years through recruiting new students and retaining current students at higher rates.
2. Recruitment efforts targeting specific states, schools, and majors based on historical data in order to meet enrollment number goals.
3. Retention strategies including participating in a collaborative initiative to improve graduation rates, setting a goal to improve retention rates 1% per year over 5 years, and providing student support services.Das presentation 2011
Das presentation 2011harrindl
╠²
1) The document discusses developing data to assess student progression at the Los Angeles Community College District.
2) It presents research questions about the progress of first-time students placed in basic skills math, including whether progress varies by ethnicity.
3) Tables show outcomes like course completion rates over three years for different ethnic groups of students placed in basic skills math.September 2019 Division Meeting
September 2019 Division MeetingUniversity of South Carolina Division of Student Affairs and Academic Support
╠²
Ad
OIR - UT Freshman Class Presentation
- 1. Freshman Class of 2009The University of Tennessee - KnoxvilleFreshman enrollment presentation prepared with information from the Office of Institutional Research and Assessment from Fall Terms 2005-2009.
- 2. 3717 New Full Time Students3698 Full time Students = 99.5%19 Part Time Students = .5%50.39% Male49.61% Female
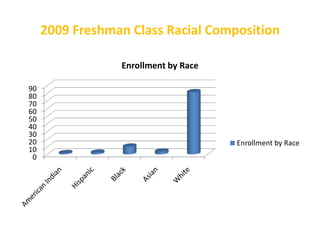
- 3. Racial Population DemographicsDiversity increasing81% Identify themselves as white(5% decrease from 2008)10% Identify as African ŌĆō American(3% increase from previous year)3.7% Identify themselves as Asian(1% increase from 2008) 2.3% Identify themselves as HispanicUnchanged1.6% (400% increase in this demographic over last 4 years 17-59) identifying themselves as American Indian 1.1% in overall student population (59)
- 4. 2009 Freshman Class Racial Composition
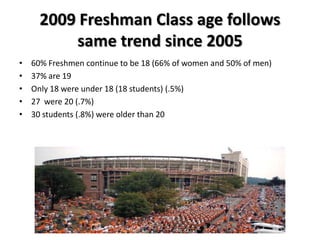
- 5. 2009 Freshman Class age follows same trend since 200560% Freshmen continue to be 18 (66% of women and 50% of men)37% are 19Only 18 were under 18 (18 students) (.5%)27 were 20 (.7%)30 students (.8%) were older than 20
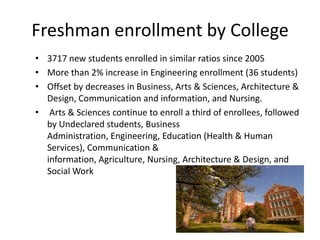
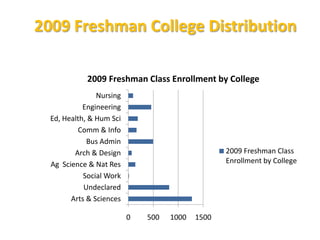
- 6. Freshman enrollment by College3717 new students enrolled in similar ratios since 2005More than 2% increase in Engineering enrollment (36 students)Offset by decreases in Business, Arts & Sciences, Architecture & Design, Communication and information, and Nursing. Arts & Sciences continue to enroll a third of enrollees, followed by Undeclared students, Business Administration, Engineering, Education (Health & Human Services), Communication & information, Agriculture, Nursing, Architecture & Design, and Social Work
- 7. 2009 Freshman College Distribution
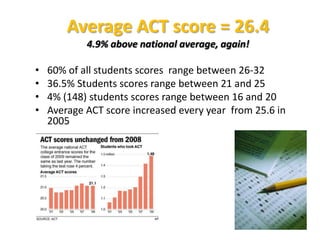
- 8. Average ACT score = 26.44.9% above national average, again!60% of all students scores range between 26-32 36.5% Students scores range between 21 and 254% (148) students scores range between 16 and 20Average ACT score increased every year from 25.6 in 2005
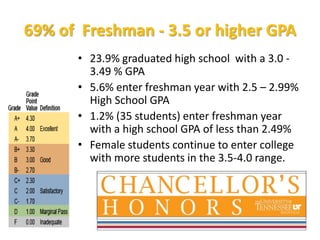
- 9. 69% of Freshman - 3.5 or higher GPA23.9% graduated high school with a 3.0 -3.49 % GPA5.6% enter freshman year with 2.5 ŌĆō 2.99% High School GPA1.2% (35 students) enter freshman year with a high school GPA of less than 2.49%Female students continue to enter college with more students in the 3.5-4.0 range.
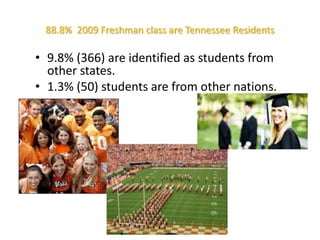
- 10. 88.8% 2009 Freshman class are Tennessee Residents 9.8% (366) are identified as students from other states.1.3% (50) students are from other nations.
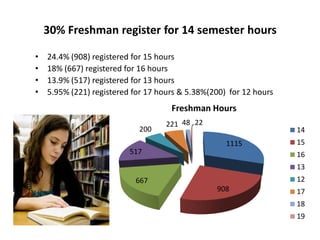
- 11. 30% Freshman register for 14 semester hours24.4% (908) registered for 15 hours18% (667) registered for 16 hours13.9% (517) registered for 13 hours5.95% (221) registered for 17 hours & 5.38%(200) for 12 hours