On the Discovery of Novel Drug-Target Interactions from Dense SubGraphs
- 1. On the Discovery of Novel Drug-Target Interactions from Dense SubGraphs Alejandro Flores Maria-Esther Vidal Guillermo Palma Universidad Sim├│n Bol├Łvar 1Graph-TA 2015
- 2. Agenda ’é¦ Motivation ’é¦ The esDSG problem ’é¦ Experimental Evaluation Graph-TA 2015 2
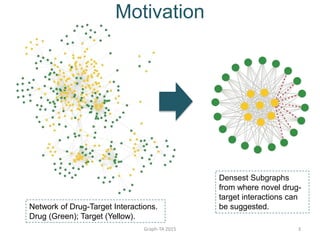
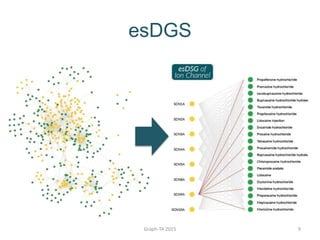
- 3. Motivation Graph-TA 2015 3 Network of Drug-Target Interactions. Drug (Green); Target (Yellow). Densest Subgraphs from where novel drug- target interactions can be suggested.
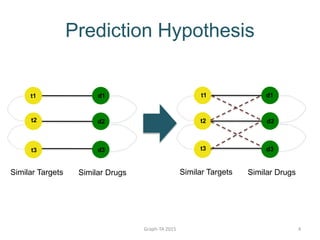
- 4. Prediction Hypothesis Graph-TA 2015 4 t1 Similar Targets Similar Drugs t2 t3 d1 d2 d3 Similar Targets Similar Drugs d1 d2 d3 t2 t3 t1
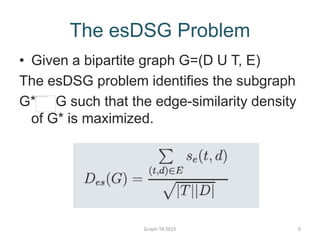
- 6. The esDSG Problem ŌĆó Given a bipartite graph G=(D U T, E) The esDSG problem identifies the subgraph G* G such that the edge-similarity density of G* is maximized. Graph-TA 2015 6
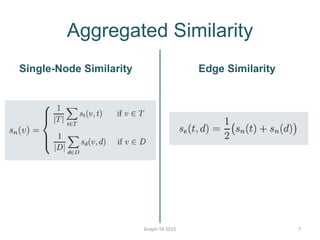
- 7. Aggregated Similarity Single-Node Similarity Edge Similarity Graph-TA 2015 7
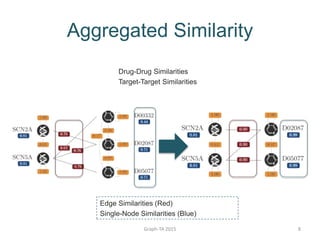
- 8. Graph-TA 2015 8 Aggregated Similarity Edge Similarities (Red) Single-Node Similarities (Blue) Drug-Drug Similarities Target-Target Similarities
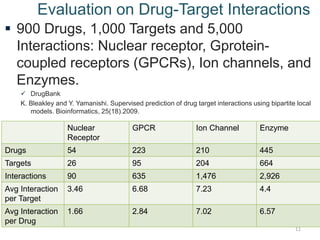
- 11. Evaluation on Drug-Target Interactions ’é¦ 900 Drugs, 1,000 Targets and 5,000 Interactions: Nuclear receptor, Gprotein- coupled receptors (GPCRs), Ion channels, and Enzymes. ’ā╝ DrugBank K. Bleakley and Y. Yamanishi. Supervised prediction of drug target interactions using bipartite local models. Bioinformatics, 25(18).2009. 11 Nuclear Receptor GPCR Ion Channel Enzyme Drugs 54 223 210 445 Targets 26 95 204 664 Interactions 90 635 1,476 2,926 Avg Interaction per Target 3.46 6.68 7.23 4.4 Avg Interaction per Drug 1.66 2.84 7.02 6.57
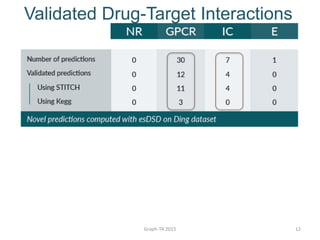
- 12. Validated Drug-Target Interactions Graph-TA 2015 12
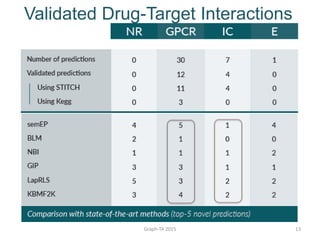
- 13. Validated Drug-Target Interactions Graph-TA 2015 13
- 14. Conclusions and Future Plans ’é¦ The esDSG problem allows for the prediction of novel interactions that cannot be suggested by state-of-the-art approaches. ’é¦ Extend esDSG to traverse different connected components to identify esDSGs from each component. Graph-TA 2015 14

