ongc report
âĒ
0 likesâĒ121 views

This document provides a summary of a project report on big data Twitter data retrieval and text mining. The project involved creating a Twitter application, installing and loading R packages for Twitter API access and text analysis, authenticating with Twitter via OAuth, extracting text from Twitter timelines, transforming and analyzing the text through techniques like stemming words and finding frequent terms and word associations, and showcasing results with a word cloud. The project was completed as part of a summer training program at the GEOPIC center of ONGC in India under the guidance of a chief manager.


ongc report
- 1. GEO- DATA PROCESSING & INTERPRETATION CENTER (GEOPIC) PROJECT REPORT ON: BBIIGG DDAATTAA TTWWIITTTTEERR DDAATTAA RREETTRRIIEEVVAALL AANNDD TTEEXXTT MMIINNIINNGG SUBMITTED BY: PRACHI CHAUHAN Btech CSE, Final Year (7th smester) Indian School of Mines(ISM), Dhanbad UNDER THE GUIDANCE OF: MR.P.R. MEENA CHIEF MANAGER (PROGRAMMING), GEOPIC, ONGC, DEHRADUN. TRAINING PERIOD: 1ST JUNE 2015 - 31ST JULY 2015
- 2. 2 DECLARATION I hereby declare that this project on BIG DATA- Twitter Data Retrieval and Text Mining is an authentic work carried out by me during the summer training at GEOPIC, ONGC, Dehradun, under the guidance and supervision of Mr P.R Meena, Chief Manager(Programming), as per a compulsory curriculum in B.Tech in Computer Science & Engineering. This project has not been submitted anywhere else for the award of any degree. Information derived from the published or unpublished work of others has been acknowledged in the list of references mentioned. PRACHI CHAUHAN I hereby declare that the above stated information is true to the best of my knowledge. P R MEENA Chief Manager, Programming, GEOPIC, ONGC, DEHRADUN.
- 3. 3 ACKNOWLEDGEMENT The contentment and bliss which accompanies the successful completion of any work is incomplete without thanking the people who made it possible. First of all, I would like to extend my special thanks to Mr.Anil Sood, Executive Director, Head of Institute, GEOPIC for granting me the privilege to undertake summer training at the prestigious organization like GEOPIC, ONGC.I wish to convey my deep gratitude to Sh. C. Kumar, General Manager (Programming), Head, System Management (Hardware & Software), CS(S/W) Division, GEOPIC for his unbridled support. I am thankful to Mr. P.R. Meena, Chief Manager (Programming) GEOPIC, ONGC for his guidance and constant supervision which paved a way towards the success of the study and the project. Finally, I would like to thank ONGC and all those who directly or indirectly helped me in the successful completion of this project Prachi Chauhan, Final year, B-Tech C.S.E. 7th Sem Admn. No. 2012JE0738 ISM Dhanbad, Dhanbad (Jharkhand)
- 4. 4
- 5. 5 Contents COMPANY PROFILE-ONGC................................................................................................ 5 ABOUT GEOPIC, ONGC .................................................................................................... 6 INFRASTRUCTURE AT GOEPIC .......................................................................................... 7 INTRODUCTION TO BIGDATA & R .................................................................................... 8 1. CREATING A TWITTER APPLICATION ................................................................. 11 2. INSTALL AND LOAD R PACKAGES ...................................................................... 15 3. CREATE AND STORE TWITTER AUTHENTICATED CREDENTIAL OBJECT ........... 16 5. EXTRACT TEXT FROM TWITTER ............................................................................... 17 5. TRANSFORMING TEXT & STEMMING WORDS ............................................................ 18 6. FREQUENT TERMS & ASSOCIATIONS, TEXT REPLACEMENT........................................ 19 8. WORD CLOUD ........................................................................................................ 20 CONCLUSION AND INFERENCE .................................................................................... 23 BIBLIOGRAPHY............................................................................................................ 24
- 6. 6 ï· COMPANY PROFILE GENESIS The Oil and Natural Gas Corporation Limited was incorporated under the companies Act, 1956 on 23rd . June 1993 after conversion from Oil and Natural Gas Commission, a statuary body established under ONGC Act 1956. The Company has its registered office at New Delhi and Corporate Office at Dehradun.The organization set-up of Oil and Natural Gas Corporation Limited is on the basis of functional specialization. Corporate ONGC works on the basis of Basins and Assets. PROGRESS Oil and Natural Gas Corporation limited (ONGC) is a Navaratna Public Sector Undertaking.It has impressive track record of progressive growth. ONGC ranks among the top 20 Exploration & Production oil companies of the world, with operations spanning across India & abroad. It is a premier national corporate contributing over 40% of domestic oil and gas production. ONGC produces crude oil, natural gas and value added products. It is engaged in all the facets of explorations and production activities, which includes seismic survey, drilling, Oil and Gas field development, production and related engineering activities. The company owns and operates land seismic crews, off shore seismic vessels, land rings, off shore drill ships and production & process installation in both land and off-shore areas. It has instituted various R&D centers under ONGC Integrated Institutes Services (OIIS) catering to various E&P activities including research, engineering, management and safety needs VISION To be world-class Oil and Gas Company integrated in energy business with dominant Indian leadership and global presence.
- 7. 7 ï· The GEOPIC, ONGC Geodata Processing and Interpretation Center (GEOPIC) is the premier seismic data processing and interpretation centre in India. Located in one of the most beautiful Doon Valley, the centre came into existence in the year 1987 to cater to the specialized needs of seismic data processing and interpretation. The centre has dedicated state-of-the-art infrastructure and specialists in the field of seismic data processing, geo scientific data interpretation, reservoir characterization and software development. GEOPIC possesses one of the finest capabilities in the world in the area of data evaluation. It has bagged a number of processing and interpretation contracts from Indian and foreign clients. These contracts were executed with perfection and have been highly acclaimed by the customers for outstanding quality of services rendered. There are four technology divisions in GEOPIC: ï· Processing Division (PROC), ï· Interactive Interpretation Group (INTEG), ï· Computer Services (S/W), ï· Computer Services (H/W) The Computer Services (S/w) Division has historically played a pivotal role in the organizational framework of Geo-data Processing & Interpretation Center, from its inception. Its primary role is to give application software consultancy to user groups in their process of enhancing the production of 2D and 3D seismic data processing. CS (SW) takes care of system administration, system software maintenance and third party seismic software catering to routine administration as related issues. Consultancy forms a major junk of the work done. It also designs and develops state-of-the-art scientific software pertaining to seismic and allied data processing. These specific seismic utilities/ programs are required by the users to augment the capability of the production mode seismic software. CS (SW) takes care of internal application software maintenance and support. Long-term development activities are also part of the work plan. Expertise of the CS (SW) is offered to other centers of ONGC as well. This involves both consultancy and solution development.
- 8. 8 ï· INFRASTRUCTURE AT GEOPIC Hardware ï IBM PC Cluster a) Linux (Redhat) cluster with 1200+ cpu cores, 12GB per node memory, 54TB storage on GPFS filesystem ï RHEL Workstations for end user applications Altix: Single system image HPCC Linux (SUSE) SMP machine from SGI with 64 CPU, 240GB memory, 20TB storage ï SGI MIPS ORIGIN 2000 â 20 CPU parallel computer a) SGI MIPS Octane work stations b) SGI MIPS low end workstations and X-terminals ï Robotic tape library with over 1300TB capacity ï Sun E10K and E15K servers. ï Gigabit/Fast Ethernet Production LAN for Processing workstations ï Gigabit/Fast Ethernet Production LAN for INTEG workstations ï Pentium PCâs on Client-Server GEOPIC-LAN/Wifi network ï Leased line Internet connectivity on all machines in GEOPIC-LAN SOFTWARE ï CentOS, Redhat Linux for major servers in PC LAN ï Fedora, MS Windows XP/Vista, MS Windows 2000 for other PC/Servers ï RHEL 4.x, SGI IRIX 6.x and Sun Solaris 8 for productions work stations and servers ï Seismic Processing packages like FOCUS/GeoDepth, Omega, Geocluster ï Seismic Interpretation software from Landmark and other venodrs on Sun Solaris, Linux ï Oracle 8i for thrid party applications ï MySQL and Apache for all inhouse applications ï Firefox and IE browser front end on workstation
- 9. 9 ï· INTRODUCTION TO BIG DATA Big data is a popular term used to describe the exponential growth and availability of data, both structured and unstructured. This data is so large that it is difficult to process using traditional database and software techniques. In most scenarios, the volume of data is too big for storage or it moves too fast exceeding the current processing capacity. Despite these problems, big data has the potential to help companies to improve operations and take more intelligent decisions. This big data is analyzed to uncover hidden patterns, unknown correlations, market trends, customer preferences and other useful business information. Here are a few examples how companies are turning big data into decision-making power on customers, security, health and more: ï· A 360 degree view of the customer: Online retailers want to find out what shoppers are doing on their sites -- pages they visit, where they linger, how long they stay, and when they leave. ï· Internet of things: The second most popular use case involves IoT-connected devices managed by hardware, sensor, and information security companies. These devices are sitting in their customers' environment, and they phone home with information about the use, health, or security of the device ï· Information security: This involves large enterprises with sophisticated information security architectures, as well as security vendors looking for more efficient ways to store petabytes of event or machine data, where Hadoop serves as a better option. ï· R LANGUAGE R is a complete, interactive, object-oriented language: designed by statisticians, for statisticians. The language provides objects, operators and functions that make the process of exploring, modeling, and visualizing data a natural one. Complete data analyses can often be represented in just a few lines of code. R is an environment for statistical analysis: Available in the R language are functions for virtually every data manipulation, statistical model, or chart that the data analyst could ever need. Not only are all the "standard" methods available, but because most cutting-edge research in statistics and predictive modeling is done in R, the latest techniques are usually available first in the R system. ï· WHY USE R? There are lots of software available for data analysis today: spreadsheets like Excel, batch-oriented procedure-based systems like SAS; point-and-click GUI-based systems like SPSS; data mining systems, and so on. What makes R different? ï· R is free. As an open-source project, you can use R free of charge: no worries about subscription fees, license managers, or user limits
- 10. 10 ï· R is a language. In R, you do data analysis by writing functions and scripts, not by pointing and clicking. It's an easy language to learn, and a very natural and expressive one for data analysis. Once you learn the language, there are many benefits. Is an interactive language (as opposed to a data-in-data-out black-box procedures). ï· Graphics and data visualization. It has excellent tools for creating graphics, from staples like bar charts and scatterplots to brand new graphics of your own devising. ï· A flexible statistical analysis toolkit. All of the standard data analysis tools are built right into the R language, from accessing data in various formats, to data manipulation (transforms, merges, aggregations, etc.), to traditional and modern statistical models (regression, ANOVA, GLM, tree models, etc.). ï· Access to powerful, cutting-edge analytics. Leading academics and researches from around the world use R to develop the latest methods in statistics, machine learning, and predictive modeling. ï· A robust, vibrant community. If you are stuck anywhere, you can easily lookup for a solution. ï· Unlimited possibilities. With R, you're not restricted to choosing a pre-defined set of routines. You can use code contributed by others in the open-source community, or extend R with your own functions. R is excellent for "mash-ups" with other applications: combine R with a MySQL database, an Apache web-server, and the Google Maps API and you've got yourself a real-time GIS analysis toolkit. ï· UNSTRUCTURED DATA It refers to information that doesn't reside in a traditional row-column database. As you might expect, it's the opposite of structured data â the data stored in fields in a database. Unstructured data is data that does not follow a specified format for big data. If 20 percent of the data available to enterprises is structured data, the other 80 percent is unstructured. Examples: satellite images, scientific data, Videos and Photographs, SONAR data and human generated unstructured data-text, mobile data, website content, social media data. ï· UNSTRUCTURED DATA & BIG DATA Many organizations believe that their unstructured data stores include information that could help them make better business decisions Structured data generally resides in a relational database, and as a result, it is sometimes called relational data. The term big data is closely associated with unstructured data. Big data refers to extremely large datasets that are difficult to analyze with traditional tools. Big data can include both structured and unstructured data, but IDC estimates that 90 percent of big data is unstructured data. The overall goal of the data mining process is to extract information from a data set and transform it into an understandable structure for further use
- 11. 11 ï· PREAMBLE Twitter is a popular service that allows users to broadcast short messages (âtweetsâ) for others to read. Over the years this has become a valuable tool not just for standard social media purposes but also for data mining experiments such as sentiment analysis. The twitteR package is intended to provide access to the Twitter API within R, allowing users to grab interesting subsets of Twitter data for their analyses. This study encompasses a comprehensive understanding of the functionalities and some basic examples of how they can be used while illustrating Text Extraction and Mining. ï· TOOLS USED ï· R-studio version 3.2.0 ï· Twitter API ï· PREREQUISITES ï· Already installed RStudio(3.2.0). ï· Used Twitter login ID and password to sign in at Twitter Developers. ï· PROCESS FLOW ï· Create a twitter app. ï· Extract data from twitter ï· Perform text cleaning ï· Analyse word frequencies ï· Perform text replacement ï· Showcase a WORD CLOUD
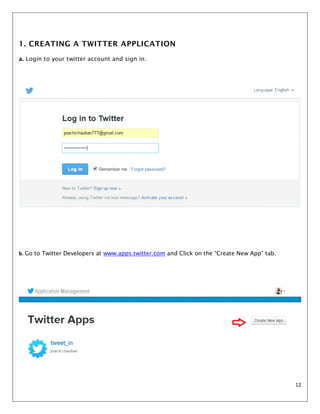
- 12. 12 1. CREATING A TWITTER APPLICATION a. Login to your twitter account and sign in. b. Go to Twitter Developers at www.apps.twitter.com and Click on the âCreate New Appâ tab.
- 13. 13 c. Fill out the new app form. Keeping the names unique. Callback URL can be left blank. Once youâve done this, read and accept the agreement fill in the CAPTCHA and click the âCreate Appâ button. Then the following would be the newly formed app.
- 14. 14 d. Note the values of Consumer key and Consumer secret and keep them handy for future use. You should keep these secret. If anyone was to get these keys, they could effectively access your Twitter account. e. Take a notice of your app keys and settings. Your settings can be modified and updated as per convenience. f. Check the app read/write permissions
- 15. 15 g. Note down the access key and access token.
- 16. 16 2. INSTALL AND LOAD R PACKAGES R comes with a standard set of packages. A number of other packages are available for download and installation. For the purpose of this project, we will need the following packages from CRAN: ï· twitter ï· ROAuth ï· RCurl ï· tm ï· SnowballC ï· Httr On windows we need to get the âcacert.pemâ object file. Download the âcacert.pemâ file from the specified URL and store it in your working directory. 3. CREATE AND STORE TWITTER AUTHENTICATED CREDENTIAL OBJECT Create an object âcredâ that will save the authenticated object for later sessions and initiate the handshake. This is where you will enter the ConsumerKey and ConsumerSecret from the first step. Once the handshake is complete it will direct you to a hyperlink in the console window. Navigate to the specified link to authorize app and click âAuthorize Appâ Note the pin number generated.
- 17. 17 In RStudio, type in the pin number. Save the object âcredâ on your local machine as âtwitter authentication.Rdata.â 4. SETUP TWITTER AUTHENTICATION Enter the access_token and access_secret to establish a session. 5. EXTRACT TEXT FROM TWITTER Here ârdmTweetsâ serves as a variable to store the tweets from the User Timeline of ârdataminingâ. A Twitter timeline is simply a stream of tweets. There are two timelines, the user timeline and the home timeline. The former provides the most recent tweets of a specified user while the latter is used to display your own most recent tweets. These both return a list of status objects. To look at a particular userâs timeline that user must either have a public account or you must have access to their account. You can either pass in the userâs name or an object of class user.
- 18. 18 5. TRANSFORMING TEXT The tweets are first converted to a data frame and then to a corpus. A corpus is a collection of text documents. âVectorSourceâ specifies that the source is character vectors. After that, the corpus needs a couple of transformations, including changing letters to lower case, removing punctuations/numbers and removing stop words. The general English stop-word list is tailored by adding "available" and "via" and removing "r". Stop words are words which are filtered out before or after processing of natural language data, stop words can cause problems when searching for phrases that include them so they have to be removed first before processing and then added later. 6. STEMMING WORDS Stemming is the term used in linguistic morphology and information retrieval to describe the process for reducing inflected or derived words to their word stem, i.e. base or root formâgenerally a written word form. Words need to be stemmed to retrieve their radicals. For instance, "example" and "examples" are both stemmed to "exampl". However, after that, one may want to complete the stems to their original forms, so that the words would look normal. The tm package does the step completion for us.
- 19. 19 7. INTERACTING WITH THE ACTUAL TEXT We can pull the most recent results from the public timeline and see the clients that were used to post those statuses. We can look at a pie chart to get a sense for the most common clients. We can search a particular hashtag and mine other relevant data. A users likes and dislikes can be observed over a time. The patterns in the mined data is the particularly important information that the companies seek for. This helps in market trend analysis and future predictions of the sales. 8. FREQUENT TERMS AND ASSOCIATIONS Frequency analysis is based on the fact that, in any given stretch of written language, certain letters and combinations of letters occur with varying frequencies. Moreover, there is a characteristic distribution of letters that is roughly the same for almost all samples of that language. Here, we calculated and stored the frequencies of the words âcourseâ and âinfoâ in the variables âcoursefreqâ and âinfofreqâ respectively. 9. REPLACING TEXT We can also replace a particular word in the entire text by another word or group of words. This way we do not have to scan the big data for a particular word and then replace it everywhere which is a tedious task. This technique can be used by companies to keep their information regularly updated. Here, we replaced the word âminingâ by âminersâ in our text.
- 20. 20 10. The Word Cloud A word cloud is a text mining method that allows us to highlight the most frequently used keywords in a paragraph of texts. It is also referred to as a text cloud or tag cloud. The procedure of creating word cloud is very simple in R software if you know the different steps to execute. A text mining package (tm) and word cloud generator package (wordcloud) are available in R for helping us to analyze texts and to quickly visualize the keywords words as a word cloud. ïķ Why to prefer a Word Cloud? ï A Tag cloud is a powerful method for text mining and, it add simplicity and clarity. The most used keywords stand out better in a word cloud. ï Word clouds are a potent communication tool. They are easy to understand, to be shared and are impactful. ï Word clouds are visually engaging than a table data.
- 21. 21 ïķ Utility of a Word Cloud. ï The word cloud finds its utility in various field workers today, namely: ï Researchers : for reporting qualitative data ï Marketers : for highlighting the needs and pain points of customers ï Educators : to support essential issues ï Politicians and journalists : for analysis trends in various issues ï social media sites : to collect, analyze and share user sentiments ïķ CREATING A WORD CLOUD To create a word cloud, first load the requires packages, tm and wordcloud. A text file is loaded using its file path and readlines function. Using the Corpus() function from tm package, a corpus of the text file is created as âdocsâ. As before, text cleaning and stemming is performed to the corpus. After that, a term document matrix (tdm or dtm) is constructed. A document-term matrix or term-document matrix is a mathematical matrix that describes the frequency of terms that occur in a collection of documents (Corpus). In a document-term matrix, rows correspond to documents in the collection and columns correspond to terms.
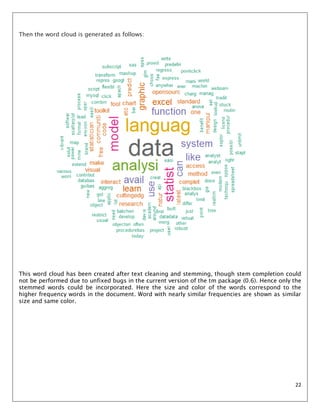
- 22. 22 Then the word cloud is generated as follows: This word cloud has been created after text cleaning and stemming, though stem completion could not be performed due to unfixed bugs in the current version of the tm package (0.6). Hence only the stemmed words could be incorporated. Here the size and color of the words correspond to the higher frequency words in the document. Word with nearly similar frequencies are shown as similar size and same color.
- 23. 23 INFERENCE: Using proper mining techniques and correct packages various types of analysis can be done on a big data. R is an extremely functional language which encompasses a wide range of methods of analysis as well as illustrating a data. Big data itself is a combination of structured as well as unstructured data of peta bytes or more, handling such a data is not practically feasible by ordinary data structure so hadoop can be further used for storage purposes. CONCLUSION: This work was a comprehensive study of how big unstructured data is handled and how companies utilize this data for a better future productivity. Text extraction was performed and illustrated well. Major data mining tasks including, text replacements, word frequency analysis, and word cloud creation were successfully implemented. The document text matrix itself has a wide range of applications ranging from Latent semantic analysis for improving search results to Multivariate analysis of reveling themes and topics of the corpus to data clustering. Finally the word cloud was created which has an immense application set including education, evaluation and text comparisons.
- 24. 24 BIBLIOGRAPHY ïķ www.rdatamining.com ïķ www.apps.twitter.com ïķ www.slideshare.com ïķ www.webopedia.com ïķ www.bigdatauniveristy.com ïķ www.sthda.com ïķ www.coursera.com