Output
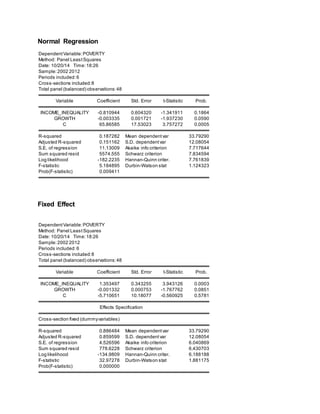
- 1. Normal Regression DependentVariable:POVERTY Method: Panel LeastSquares Date: 10/20/14 Time:18:26 Sample:2002 2012 Periods included:6 Cross-sections included:8 Total panel (balanced) observations:48 Variable Coefficient Std. Error t-Statistic Prob. INCOME_INEQUALITY -0.810944 0.604320 -1.341911 0.1864 GROWTH -0.003335 0.001721 -1.937230 0.0590 C 65.86585 17.53023 3.757272 0.0005 R-squared 0.187282 Mean dependentvar 33.79290 Adjusted R-squared 0.151162 S.D. dependentvar 12.08054 S.E. of regression 11.13009 Akaike info criterion 7.717644 Sum squared resid 5574.555 Schwarz criterion 7.834594 Log likelihood -182.2235 Hannan-Quinn criter. 7.761839 F-statistic 5.184895 Durbin-Watson stat 1.124323 Prob(F-statistic) 0.009411 Fixed Effect DependentVariable:POVERTY Method: Panel LeastSquares Date: 10/20/14 Time:18:26 Sample:2002 2012 Periods included:6 Cross-sections included:8 Total panel (balanced) observations:48 Variable Coefficient Std. Error t-Statistic Prob. INCOME_INEQUALITY 1.353497 0.343255 3.943126 0.0003 GROWTH -0.001332 0.000753 -1.767762 0.0851 C -5.710651 10.18077 -0.560925 0.5781 Effects Specification Cross-section fixed (dummyvariables) R-squared 0.886484 Mean dependentvar 33.79290 Adjusted R-squared 0.859599 S.D. dependentvar 12.08054 S.E. of regression 4.526596 Akaike info criterion 6.040869 Sum squared resid 778.6228 Schwarz criterion 6.430703 Log likelihood -134.9809 Hannan-Quinn criter. 6.188188 F-statistic 32.97278 Durbin-Watson stat 1.881175 Prob(F-statistic) 0.000000
- 2. Random Effect DependentVariable:POVERTY Method: Panel EGLS (Cross-section random effects) Date: 10/20/14 Time:18:27 Sample:2002 2012 Periods included:6 Cross-sections included:8 Total panel (balanced) observations:48 Swamy and Arora estimator ofcomponentvariances Variable Coefficient Std. Error t-Statistic Prob. INCOME_INEQUALITY 0.176665 0.297120 0.594591 0.5551 GROWTH -0.001965 0.000734 -2.679417 0.0103 C 32.28042 8.784750 3.674597 0.0006 Effects Specification S.D. Rho Cross-section random 2.579440 0.2451 Idiosyncratic random 4.526596 0.7549 Weighted Statistics R-squared 0.051060 Mean dependentvar 19.68061 Adjusted R-squared 0.008885 S.D. dependentvar 8.057974 S.E. of regression 8.022097 Sum squared resid 2895.932 F-statistic 1.210668 Durbin-Watson stat 1.120413 Prob(F-statistic) 0.307519 Unweighted Statistics R-squared 0.081349 Mean dependentvar 33.79290 Sum squared resid 6301.170 Durbin-Watson stat 0.847309

