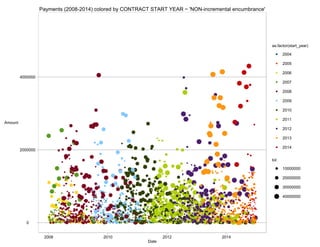
The document shows a line graph of the total amount of payments made each year from 2008 to 2014, with the payments broken down and colored by the start year of the contract that each payment was associated with. The total payments increased over time from about 10 million in 2008 to over 40 million in 2014.
1 of 1
Download to read offline
More Related Content
Pays_0814_STARTYEAR_NONincrem
1. 0
2000000
4000000
2008 2010 2012 2014
Date
Amount
as.factor(start_year)
2004
2005
2006
2007
2008
2009
2010
2011
2012
2013
2014
tot
10000000
20000000
30000000
40000000
Payments (2008-2014) colored by CONTRACT START YEAR ~ 'NON-incremental encumbrance'